



The World's Most Expensive Electricity Is Made In Britain: Here's Exactly Where Your Money Goes
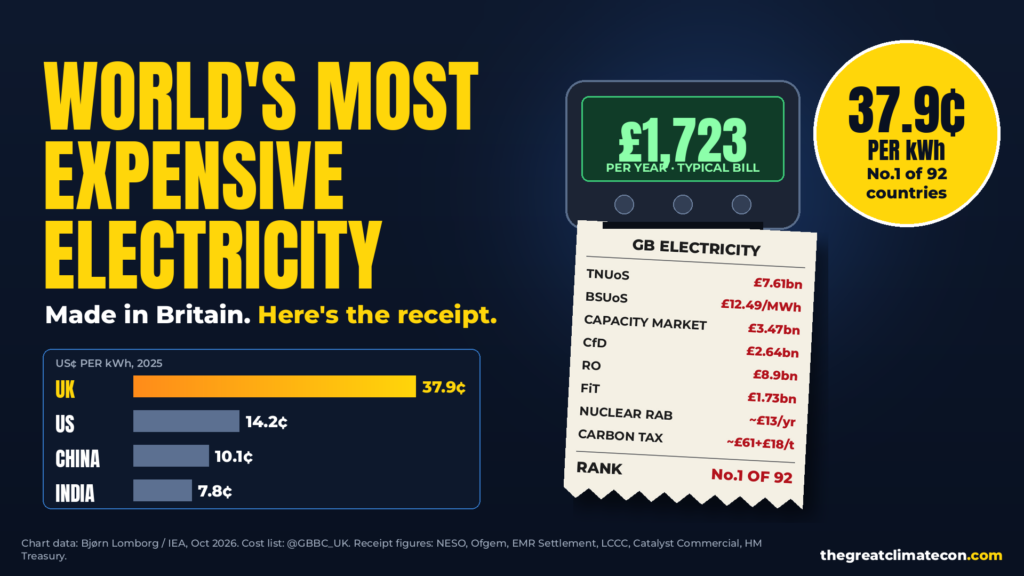
Britain now pays more for electricity than any of the 92 countries in Bjørn Lomborg’s IEA-based ranking, 2.7 times the US and 3.7 times China. It isn’t bad luck. It’s a stack of grid charges, green subsidies and carbon taxes added to every bill to keep a weather-dependent grid running. Here they are, line by line.
By Travis Cook, The Great Climate Con. Built on a post by the Great British Business Council (@GBBC_UK, 28 October 2026), with the “Costliest electricity 2025” chart by Bjørn Lomborg, from International Energy Agency end-use price data.
Ask the government why your electricity bill is so high and you’ll hear one word: gas. Ask the numbers and you get a very different answer.
The Great British Business Council put it plainly this week: “To anyone wondering where the UK’s extra costs come from…” Then it listed them. Charges to run a grid built around intermittent wind and solar. Subsidies to prop up renewable generators. And then compensation for the industries being crushed by the first two. We’ve checked every line against the official figures from NESO, Ofgem, the government and the Low Carbon Contracts Company. GBBC is right.
The ranking
Britain has the most expensive electricity on Earth
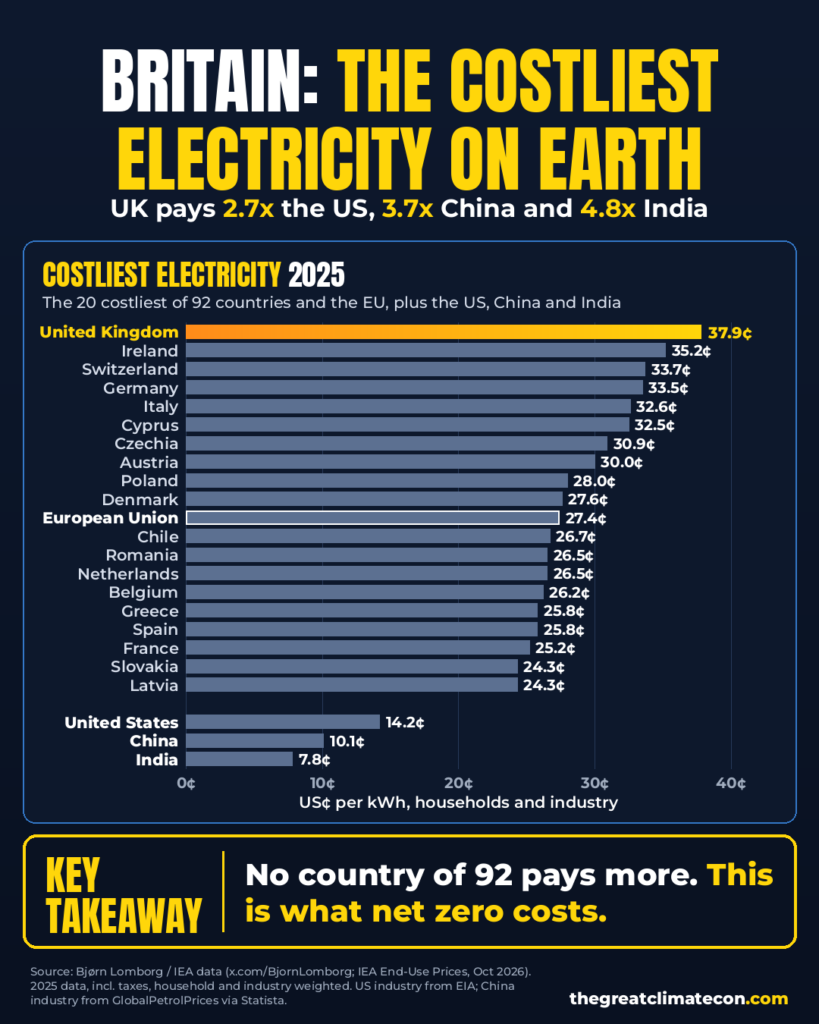
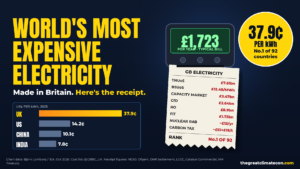
Bjørn Lomborg has ranked 2025 electricity prices for households and industry across 92 countries plus the EU, using International Energy Agency data published in October 2026. The United Kingdom comes top at 37.9 US cents per kWh.
- The UK pays 2.7 times the United States (14.2¢).
- The UK pays 3.7 times China (10.1¢).
- The UK pays 4.8 times India (7.8¢).
- The UK even beats the EU average (27.4¢), Ireland (35.2¢) and Germany (33.5¢), the country that wrote the green-energy playbook.
Lomborg summed it up: “Climate policies have consequences… UK has the costliest electricity in the world.”
The countries at the cheap end of the chart didn’t find some secret supply of cheap electrons. They just didn’t load their grids with the costs below. We have been saying it for a long time: the real reason your electricity bills keep going up is policy.
Part 1
Part 1: The cost of running a grid on the weather
GBBC’s first group is the cost of building and running a grid around power that turns up when the wind blows rather than when you need it.
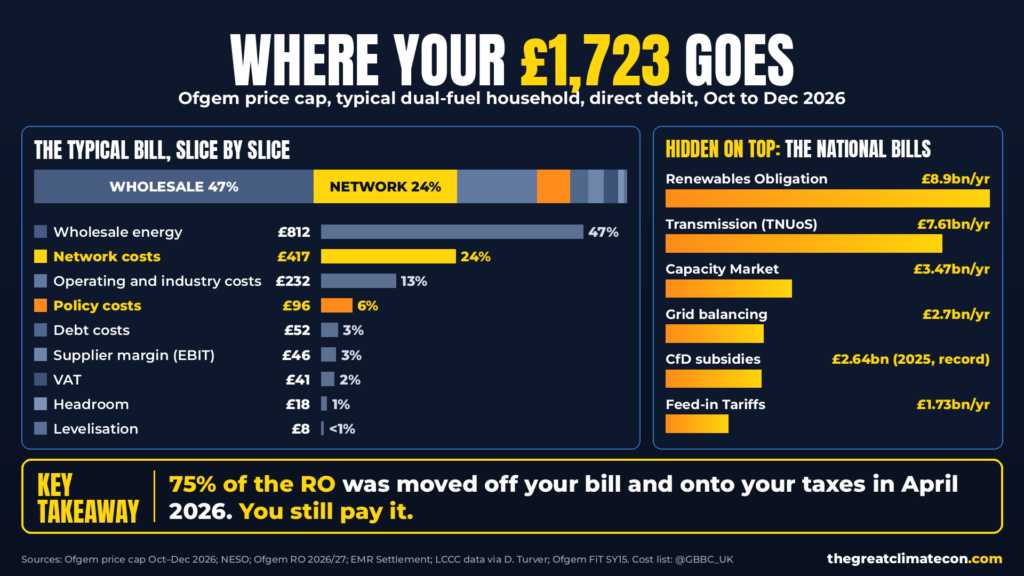
On Ofgem’s price cap for October to December 2026, a typical household on direct debit pays £1,723 a year. £417 of that, or 24%, is network costs before a single unit of energy is counted. That’s bigger than every slice except the wholesale energy itself.
01
TNUoS
Transmission Network Use of System (TNUoS)
TNUoS pays for the high-voltage pylon network. For 2026/27, NESO has set the total to be recovered at £7.61 billion. The network is being rebuilt for one main reason: the new generation is wind farms in the far north of Scotland and out at sea, hundreds of miles from where people live and work. Every new cable to reach them goes on the bill. As GBBC points out, gas plants built near the towns and cities that use the power wouldn’t need most of it.
02
BSUoS
Balancing and curtailment (BSUoS)
The Balancing Services Use of System charge pays NESO to keep the grid stable minute by minute. From October 2026 to March 2027 it is £12.49 per MWh, or about £31 a year on a typical 2,500 kWh electricity bill.
The biggest part of balancing is constraint payments. Balancing the grid cost £2.7 billion in 2024/25, and £1.7 billion of that was thermal constraints, up 64% in a single year (NESO). NESO’s explanation is high wind output on a network that can’t carry it, so it has to take “a greater volume of bid actions on wind generators”. In plain English: wind farms are paid to switch off, and gas plants nearer the demand are paid to switch on and fill the gap. You pay for both.
Constraint costs were about £400 million in 2018/19. Bill payers have now covered more than £6.6 billion in constraint payments over seven years (The Herald, from NESO records). NESO itself expects balancing costs to keep climbing to a peak of around £8 billion a year in 2030. We covered this in Wind Farms Increase Profits 60% By Doing Nothing and Solar Installations Being Paid To Switch Off.
03
Capacity Market
The Capacity Market
The Capacity Market pays power stations simply to be there in case they’re needed: a standing backup for the windless, dark winter evening. For the 2026/27 delivery year the total annual capacity payments come to £3.47 billion (EMR Settlement). That’s the price of a grid that can’t trust its own headline generators, as Lomborg puts it: “you need near-100% backup when no sun or wind, paying for two systems”. See Wind Turbines Stop Working When The Wind Stops.
04
DUoS
Distribution Use of System (DUoS)
DUoS pays for the local wires and substations that bring power to your street. Together with TNUoS and BSUoS, it makes up the £417 a year in network costs on the typical household bill (Ofgem). Rooftop solar, heat pumps and electric cars are all pushing local networks to be dug up and upgraded, and the cost lands in the same place.
Part 2
Part 2: Subsidies to prop up renewable generation
GBBC’s second group is the straight subsidies. These are payments that exist only because wind, solar and biomass can’t pay their way on the open market.
01
CfD
Contracts for Difference (CfD)
CfDs guarantee generators a fixed “strike price”. When the market price is lower, bill payers make up the difference. In calendar year 2025, the CfD scheme paid out a record net £2.64 billion, with more than £2 billion of it going to offshore wind (analysis of Low Carbon Contracts Company data by David Turver). For October to December 2026, suppliers pay a CfD levy of £5.529 per MWh on every unit sold (LCCC / EMR Settlement).
02
RO
The Renewables Obligation (RO)
The RO is the old subsidy scheme, and it runs until 2037. Ofgem values it at £8.9 billion for 2026/27: 0.472 certificates per MWh at £69.34 each. That makes it the single biggest green subsidy on the system. Most of it goes to the wind farms and biomass plants built in the 2000s and 2010s, including Drax.
From April 2026 the government moved 75% of the household share of the RO off your energy bill and onto general taxation. By its own figures that “saves” £88 on an average bill. Nothing was saved. The same subsidy is now paid through your taxes instead of your meter, and the government’s own scheme papers say it is temporary, running from 2026/27 to 2028/29.
03
FiT
Feed-in Tariffs (FiT)
FiT pays out for the small solar panels and wind turbines installed under the 2010 scheme. In scheme year 15 (April 2024 to March 2025) it cost £1.73 billion (Ofgem). Every household pays for subsidies that a minority with panels on their roof collect, for up to 25 years. More in Why Solar Panels Suck.
04
Nuclear RAB
The nuclear levy (RAB)
The Regulated Asset Base levy charges bill payers for Sizewell C while it’s still being built, years before it produces a single unit of power. Ofgem puts it at about £13 a year on a typical household bill through 2026. For October to December 2026, suppliers pay an interim levy of £3.754 per MWh (EMR Settlement).
Add them up. Using the latest annual figures, the RO (£8.9bn), the Capacity Market (£3.47bn), CfDs (£2.64bn) and FiT (£1.73bn) come to more than £16 billion a year. Add TNUoS (£7.61bn) and balancing (£2.7bn) and it’s more than £27 billion a year in charges on top of the energy itself. As GBBC says, government could cut much of this “with a stroke of a pen”.
Charge
Latest annual figure
Source
Renewables Obligation (2026/27)
£8.9bn
Ofgem
Transmission, TNUoS (2026/27)
£7.61bn
NESO
Capacity Market (2026/27)
£3.47bn
EMR Settlement
Grid balancing (2024/25)
£2.7bn
NESO
Contracts for Difference (2025)
£2.64bn
LCCC data, David Turver
Feed-in Tariffs (scheme year 15)
£1.73bn
Ofgem
Part 3
Part 3: Paying industry to survive the bills you created
GBBC’s third group is the cruellest. Electricity is so expensive that heavy industry can’t survive it, so the government pays industry back, and the rest of us pick up that bill too.
- Exemptions: Under the British Industry Supercharger, energy-intensive industries have been 100% exempt from CfD, RO and FiT costs since April 2024, and from Capacity Market costs since October 2024 (gov.uk).
- The Energy Intensive Industries Support Levy (ESL): this levy funds compensation for 90% of eligible firms' network charges from April 2026, up from 60%. The levy itself rises from April 2027 (gov.uk).
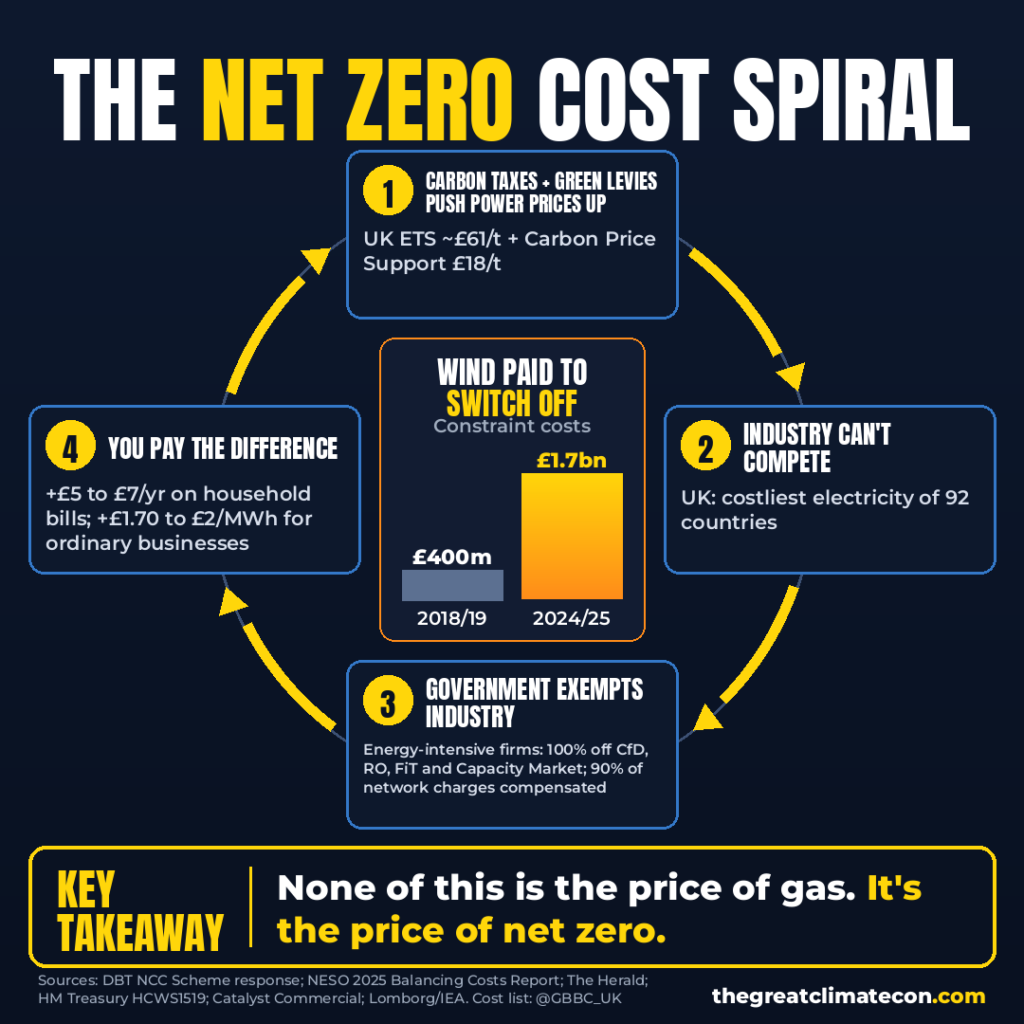
- Who pays: everyone who doesn't qualify. The government's own estimate is £5 to £7 a year extra on household electricity bills from the Supercharger package. Ordinary businesses pay £1.70 to £2 per MWh on top, which means more on the bill of every pub, shop and small manufacturer.
On top of all that sit the carbon taxes. Every gas-fired power station pays for its emissions through the UK Emissions Trading Scheme, at about £61 a tonne at the end of September 2026, plus the Carbon Price Support tax of £18 a tonne a top-up tax charged only in Great Britain. Gas sets the price of power most of the time, so that carbon cost runs straight through to everyone’s bill. The government has now admitted the problem: in April 2026 it announced Carbon Price Support will be scrapped from April 2028, saying it “is no longer fit for purpose” and that removing it will help offset the cost of its new industry support scheme. And Britain is about to add a carbon border tax on imports: CBAM, yet another carbon tax.
So the system runs like this. Carbon taxes and green levies push prices up. Industry starts to collapse. Government exempts industry. The cost moves onto households and small firms. Then government takes some of it off your bill and puts it on your tax return, and calls that a saving. It’s the same story we told in Renewable Energy Is Causing Fuel Poverty For Millions In The UK and Steel Industry (Special Measures) Bill.
The bottom line
The bottom line
- The UK has the costliest electricity of 92 countries plus the EU: 37.9¢/kWh, 2.7x the US, 3.7x China and 4.8x India (Lomborg, from IEA data).
- £417 of a typical £1,723 household bill (24%) is network costs, before you've paid for any energy (Ofgem, Oct to Dec 2026).
- £2.7 billion to balance the grid in a year, £1.7 billion of it constraint costs, heading to around £8 billion by 2030 (NESO).
- £8.9 billion a year for the Renewables Obligation, £3.47bn for the Capacity Market, £2.64bn for CfDs, £1.73bn for Feed-in Tariffs.
- "£150 off your bill" isn't a cut. £88 of it is a green subsidy moved off your bill and onto your taxes, and £59 is a home insulation levy that's been dropped.
- Industry is exempt, so you pay instead: £5 to £7 a year on household bills, and £1.70 to £2/MWh for ordinary businesses.
- Carbon taxes on top: UK ETS at about £61/t, plus Carbon Price Support at £18/t.
None of this is the price of gas. It’s the price of net zero, itemised. GBBC’s answer is the right one: “drop the UK’s carbon taxes, increased network costs and renewable subsidies that have driven up prices in the first place.” Track the running total on our UK Net Zero Cost Trackers, and read What Would Happen If The UK Dropped Net Zero Tomorrow? and Net Zero And Renewables Bringing Britain To The Brink Of An Energy Crisis.
Credit: The cost breakdown comes from the Great British Business Council (@GBBC_UK, gbbc.uk). The “Costliest electricity 2025” chart is by Bjørn Lomborg, using International Energy Agency end-use price data (October 2026).
Sources
Sources
- Great British Business Council (@GBBC_UK), post, 28 October 2026 (opens in a new tab)
- Bjørn Lomborg, "Costliest electricity 2025" chart, 27 October 2026 (opens in a new tab)
- Data: IEA End-Use Energy Prices (opens in a new tab)
- Ofgem, Summary of changes to energy price cap, 1 October to 31 December 2026 (opens in a new tab)
- Ofgem price cap component breakdown (opens in a new tab)
- NESO, Final TNUoS Tariffs 2026/27 (opens in a new tab)
- NESO, BSUoS Final 2026/27 Tariffs (opens in a new tab)
- NESO, 2025 Annual Balancing Costs Report (opens in a new tab)
- NESO Annual Report 2025 (opens in a new tab)
- The Herald, "Households foot 'absurd' £6.6bn bill to switch off green energy" (opens in a new tab)
- EMR Settlement, Key figures for payments 2026/27 (Capacity Market, CfD levy, nuclear RAB levy) (opens in a new tab)
- EMR Settlement, CfD Q4 2026 adjustment (opens in a new tab)
- David Turver, "Another Record Year for CfD Subsidies in 2025" (LCCC data) (opens in a new tab)
- Ofgem, RO buy-out price 2026/27 (opens in a new tab)
- Ofgem, RO scheme value £8.9bn (opens in a new tab)
- DESNZ, What does the Autumn Budget mean for your energy bills? (opens in a new tab)
- DESNZ, RO/ECO costs direction 2026 (opens in a new tab)
- Ofgem, Feed-in Tariffs Annual Report, Scheme Year 15 (opens in a new tab)
- Ofgem, nuclear RAB price cap allowance (opens in a new tab)
- DBT, Network Charging Compensation uplift: government response (opens in a new tab)
- UK ETS price (UKA £61.41/t, 30 Sept 2026), Catalyst Commercial Oct26 Energy Market Brief (opens in a new tab)
- Written Ministerial Statement HCWS1519 (Carbon Price Support removal from April 2028), 16 April 2026 (opens in a new tab)
Source links open in a new tab.
Want to win the energy bill argument every time? Unlock every lesson, book and course in The Climate Con Learning Centre. Join the membership or support the work.
Books, plus the free e-book Rich in Energy, Poor in Policy.
The Advanced Guide To The Climate Con
The Beginners Guide To The Climate Con
Continue Your Learning

Climate Disaster Deaths Are Down 97.5%. So Where Exactly Is The Climate Emergency?
In the 1920s, floods, droughts, storms and wildfires killed around 485,000 people a year. Today it’s about 12,000, on a planet with more than four times as many people. Lucy Biggers asked the question the climate lobby can’t answer: if the climate is so deadly, why doesn’t it show up in the death toll?
The World’s Most Expensive Electricity Is Made In Britain: Here’s Exactly Where Your Money Goes
Britain now pays more for electricity than any of the 92 countries in Bjørn Lomborg’s IEA-based ranking, 2.7 times the US and 3.7 times China. It isn’t bad luck. It’s a stack of grid charges, green subsidies and carbon taxes added to every bill to keep a weather-dependent grid running. Here they are, line by line.

New Satellite Study Puts Greenland’s Ice Loss At About Half The Official Estimates, And Even Those Are 0.01% A Year
A new Chinese satellite study puts Greenland’s ice loss at about 120 billion tonnes a year, about half the international benchmark for the same years and 55% below NASA’s headline 264. Even the biggest official figure is about one hundredth of one per cent of the ice sheet a year.
BBC Bitesize And Net Zero: When A Lesson Becomes A Campaign
A BBC Bitesize net zero lesson tells 11 to 14-year-olds they “may need to fly less, eat less meat” and asks if they could petition the council. Is that a lesson or a campaign?

The Greening Of The Deserts: How Rising CO₂ Is Making The Planet Greener
Satellites show a quarter to half of Earth’s vegetated land has greened since the early 1980s, and models put most of it down to CO₂. Why is this never on the news?

The Tree Under The Glacier: The 6,000-Year-Old Pine The Ice Gave Back
Trees once grew where Alpine glaciers sit today, with far less CO₂ in the air. Climate has always changed, so why is that left out of the story?
Track The Cost Of Net Zero
Stay ahead of the transition with real-time cost monitoring and optimization tools.
Access Cost Trackers →