
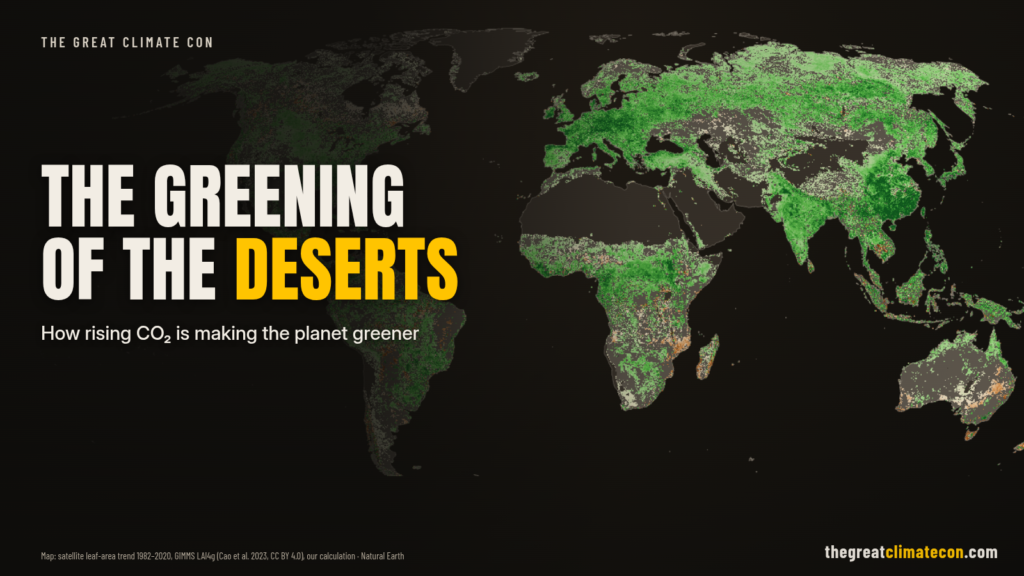
The Satellites Say The Planet Is Getting Greener
In 2016, 32 scientists from 24 institutions in eight countries published a study in Nature Climate Change called “Greening of the Earth and its drivers”. They used three long-term satellite records of leaf area (how much leaf cover sits over each patch of ground) from NASA’s MODIS and NOAA’s AVHRR instruments (NASA).
Here’s what they found for 1982–2009, in their own words: “a persistent and widespread increase of growing season integrated LAI (greening) over 25% to 50% of the global vegetated area, whereas less than 4% of the globe shows decreasing LAI (browning)” (Zhu et al. 2016).
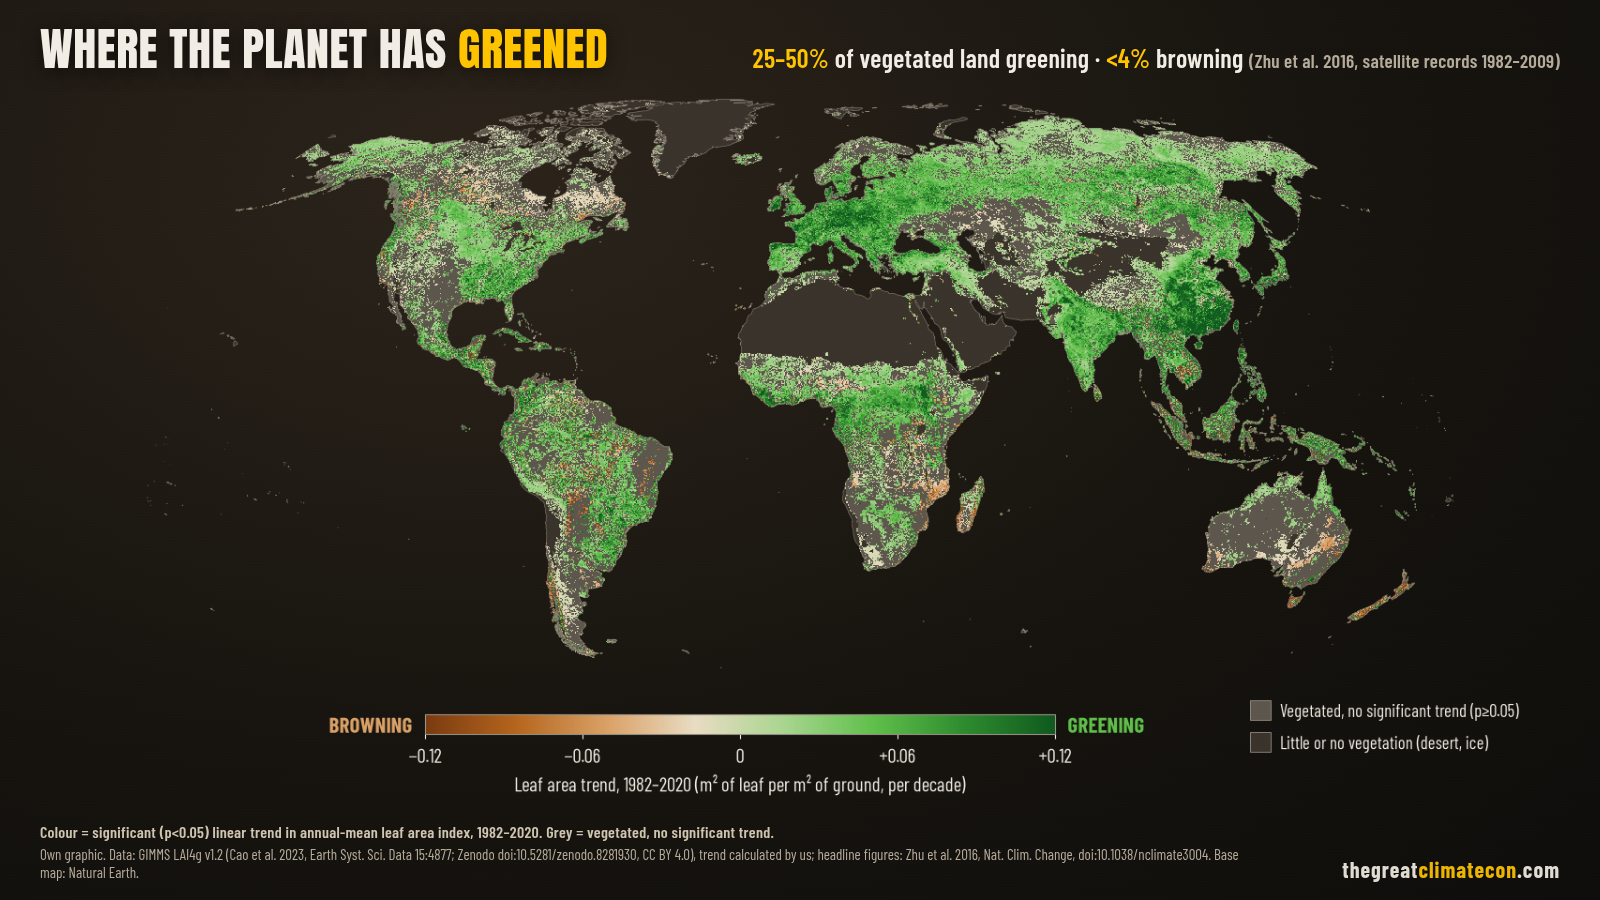
Newer satellite data tell the same story. A Boston University team using MODIS records for 2000–2017 found global green leaf area up by 5% since the early 2000s, “an area equivalent to all of the Amazon rainforests”. Overall, “one-third of Earth’s vegetated lands are greening, while 5 percent are growing browner” (NASA Earth Observatory, on Chen et al. 2019).
A 2020 review in Nature Reviews Earth & Environment, with Shilong Piao as lead author, sums it up plainly: vegetation greenness “has been increasing globally since at least 1981”, and recent data suggest it “has continued past 2010” (Piao et al. 2020).
So What’s Driving It? Mostly CO₂
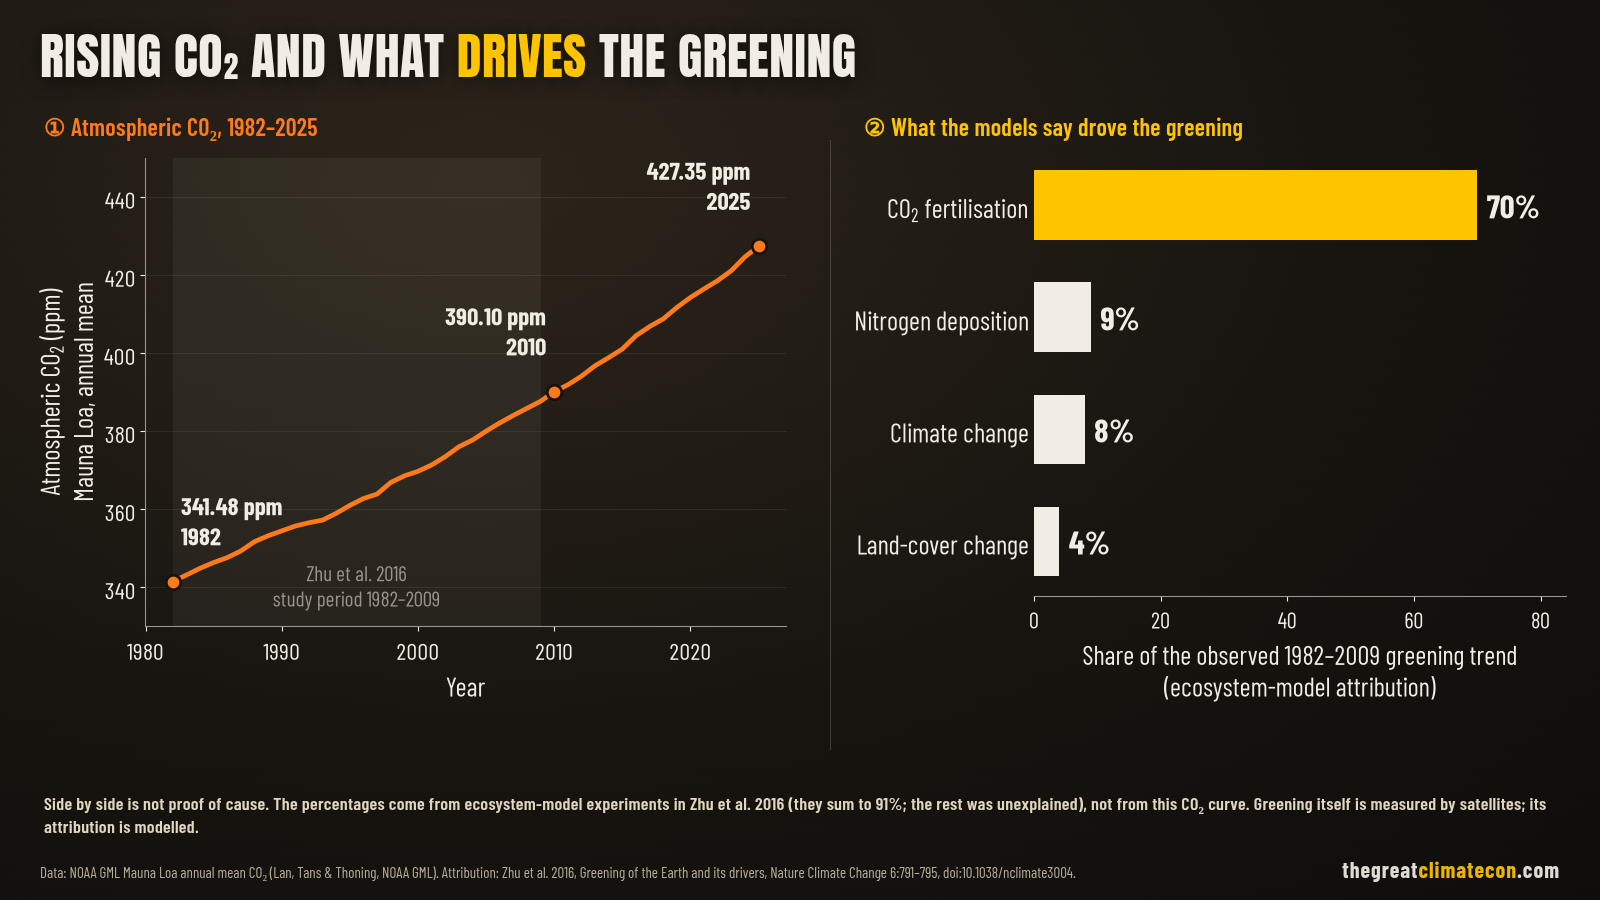
This is the bit that never makes the evening news. The Zhu team ran the satellite data through ten global ecosystem models to separate out the causes. Their result: “CO2 fertilization effects explain 70% of the observed greening trend, followed by nitrogen deposition (9%), climate change (8%) and land cover change (LCC) (4%)” (Zhu et al. 2016).
Co-author Ranga Myneni of Boston University said it straight: “So we see what an outsized role CO2 plays in this process” (NASA). The Piao review reaches the same conclusion: “CO2 fertilization is the main driver of greening on the global scale, with other factors being notable at the regional scale” (Piao et al. 2020).
To be fair about it, that 70% is a model result, not a direct measurement. Co-author Josep Canadell of CSIRO put it this way: “While the detection of greening is based on data, the attribution to various drivers is based on models” (NASA). People matter too. Chen and colleagues found China and India lead the 2000–2017 greening through tree planting and intensive farming, and that this direct human factor accounts for “over a third, and probably more” of the net increase in green leaf area (Chen et al. 2019).
Either way, the extra plant food is real. CO₂ at Mauna Loa averaged 341 ppm in 1982 and 427 ppm in 2025 (NOAA).
How CO₂ Helps Plants Save Water
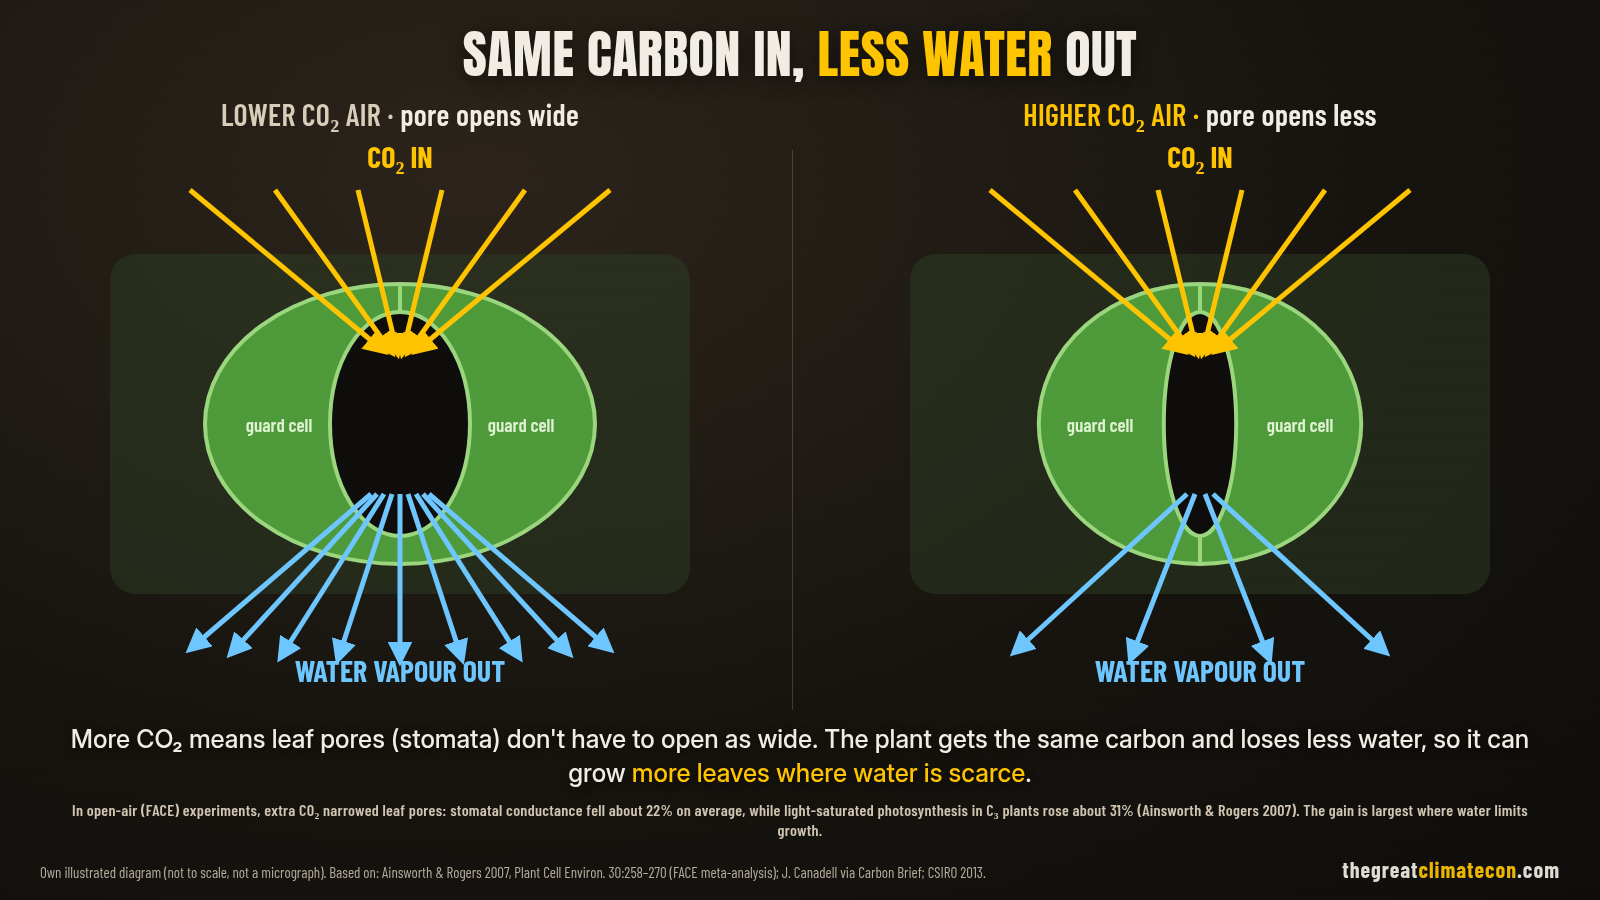
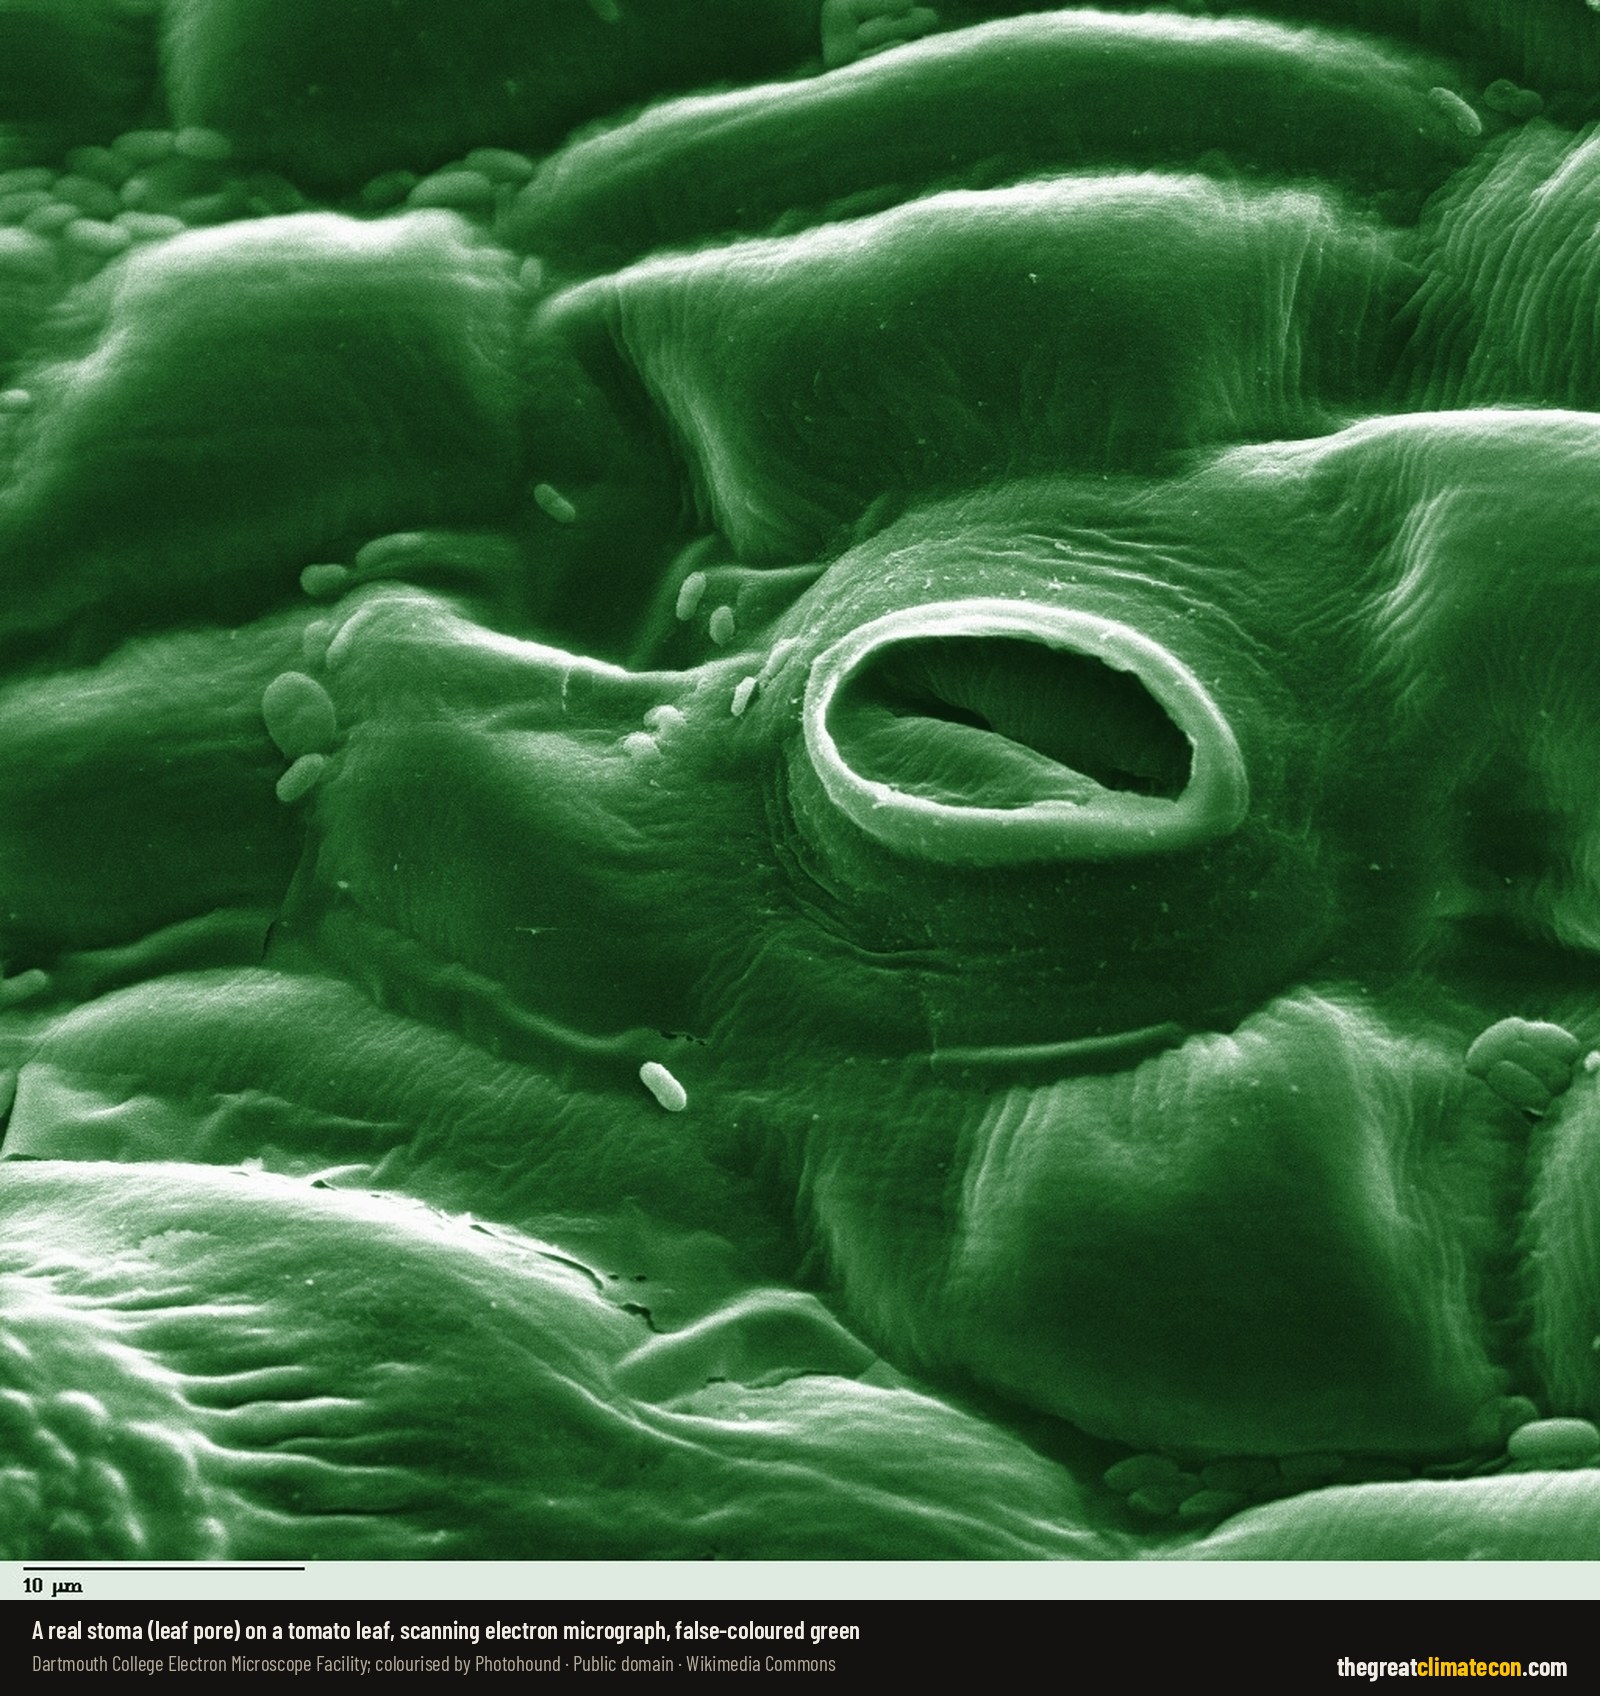
Every leaf is covered in tiny pores called stomata. They let CO₂ in, and every time they open, water escapes. That is the trade-off every plant on Earth has to manage.
Give the plant more CO₂ and that trade-off gets better. Canadell explained it to Carbon Brief: “When CO₂ levels rise, plants don’t need to open their ‘stomata’ (small pores on the leaves’ surface) as much to absorb the same amount of CO₂. This also reduces the loss of water through the same pores… Both more CO₂ and saving water increases plant growth” (Carbon Brief).
CSIRO, Australia’s national science agency, says elevated CO₂ lets a leaf “extract more carbon from the air or lose less water to the air, or both”. And when each leaf uses less water, “plants in arid environments will respond by increasing their total numbers of leaves” (CSIRO).
The Desert Margins Are Where It Shows Most
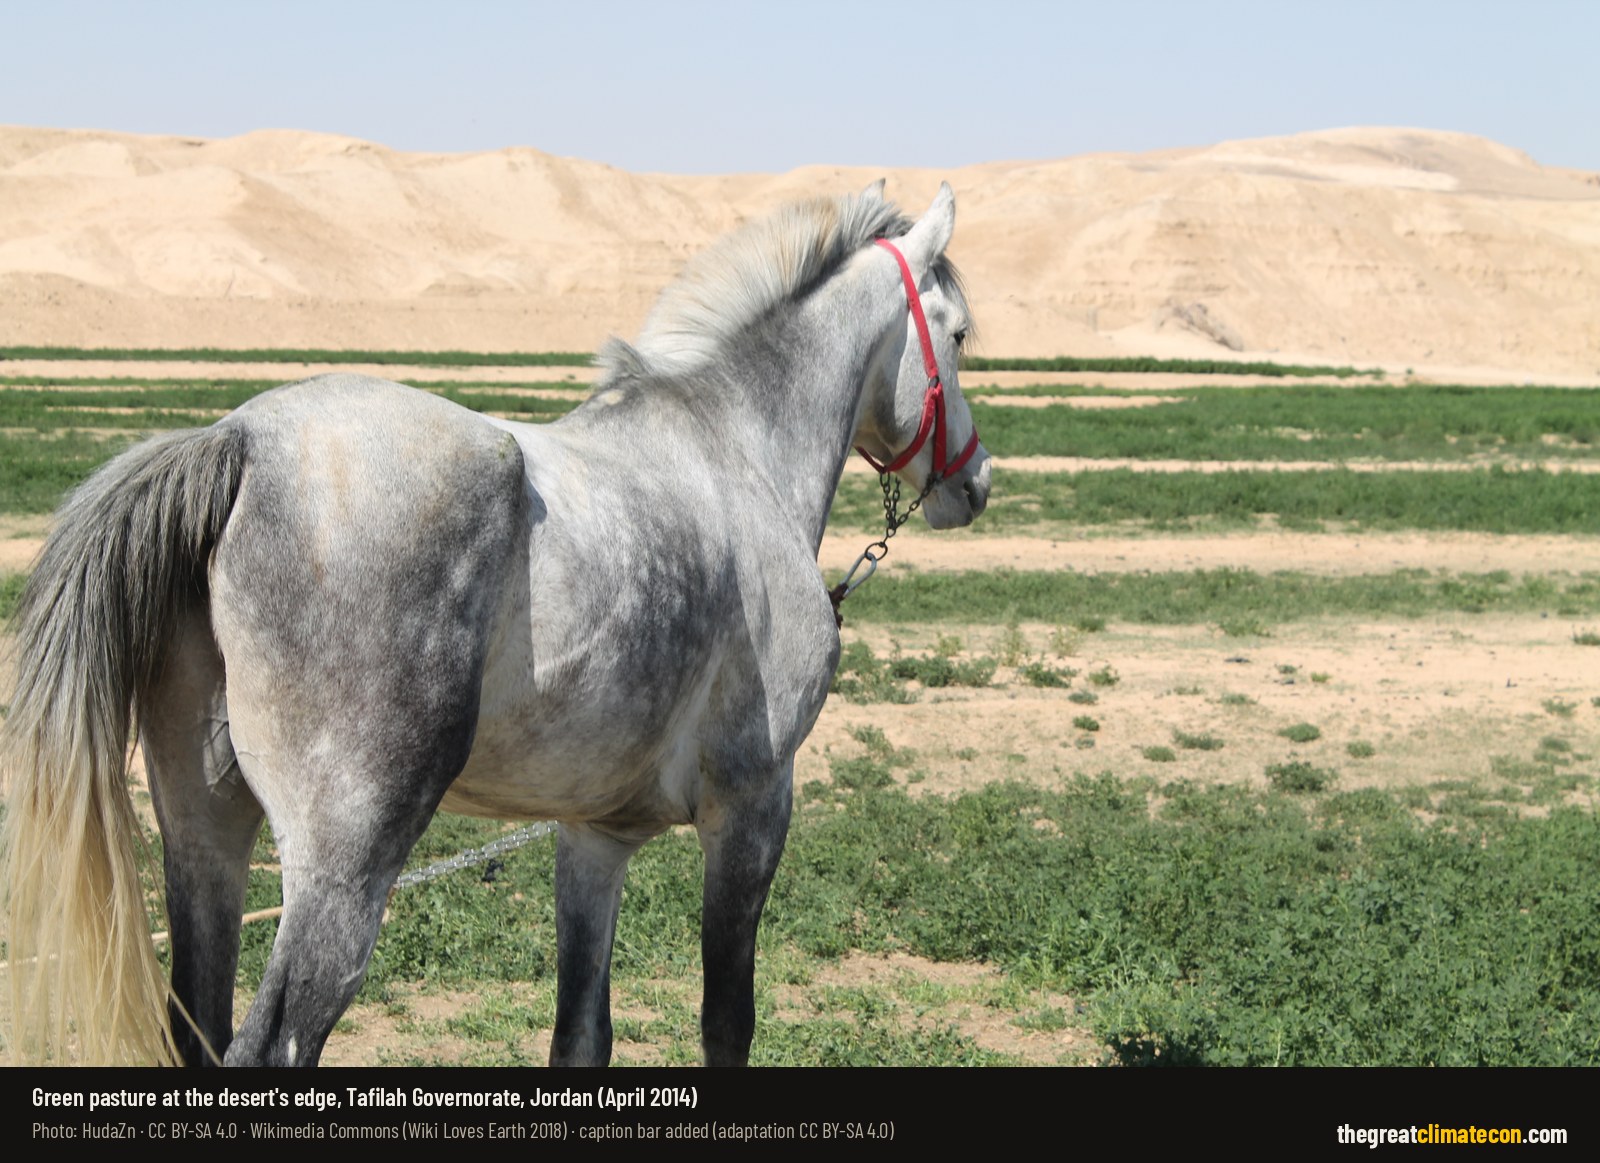
If CO₂ is doing the work, you’d expect to see it most in the dry places, where water, not sunlight or nutrients, decides how much can grow. That’s what CSIRO’s Randall Donohue and colleagues set out to test.
Their reasoning was that the CO₂ effect “should be most clearly expressed in warm, arid environments where water is the dominant limit to vegetation growth”. From gas exchange theory, they predicted that the 14% rise in CO₂ between 1982 and 2010 should have raised green foliage cover in those regions by 5 to 10%. The satellites, once the effect of rainfall changes was taken out, showed cover “has increased by 11%” (Donohue et al. 2013, Geophysical Research Letters).
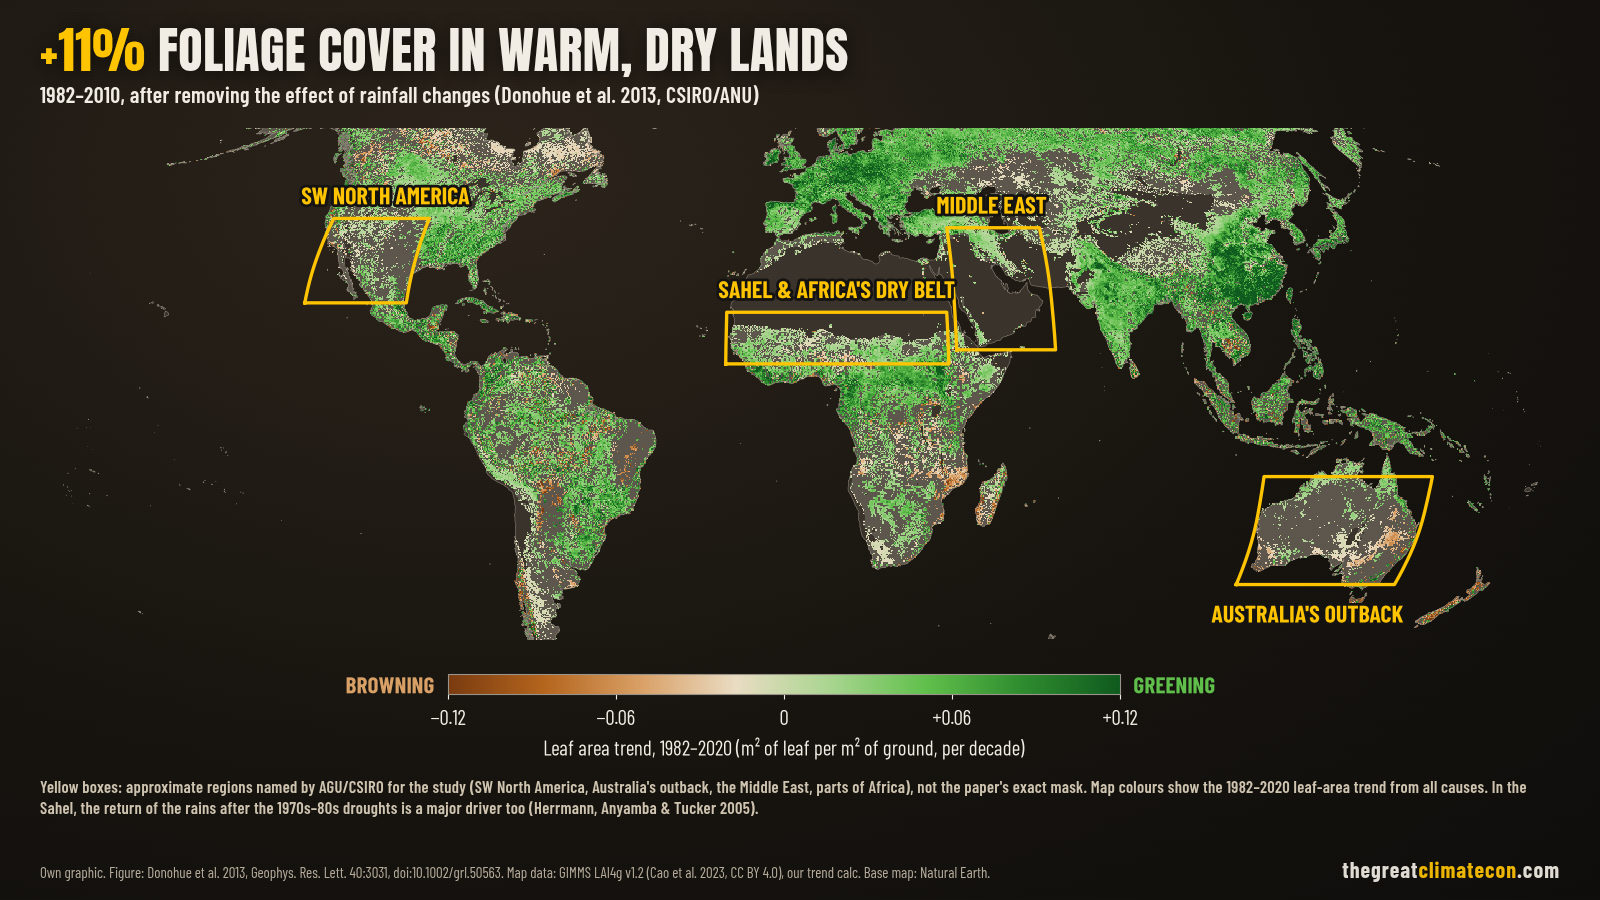
The regions in focus were “the southwestern corner of North America, Australia’s outback, the Middle East, and some parts of Africa” (AGU). Australia stood out. As Donohue said, “Australian vegetation seems quite sensitive to CO2 fertilisation”, and with its vast arid landscapes “Australia featured prominently in our results” (CSIRO).
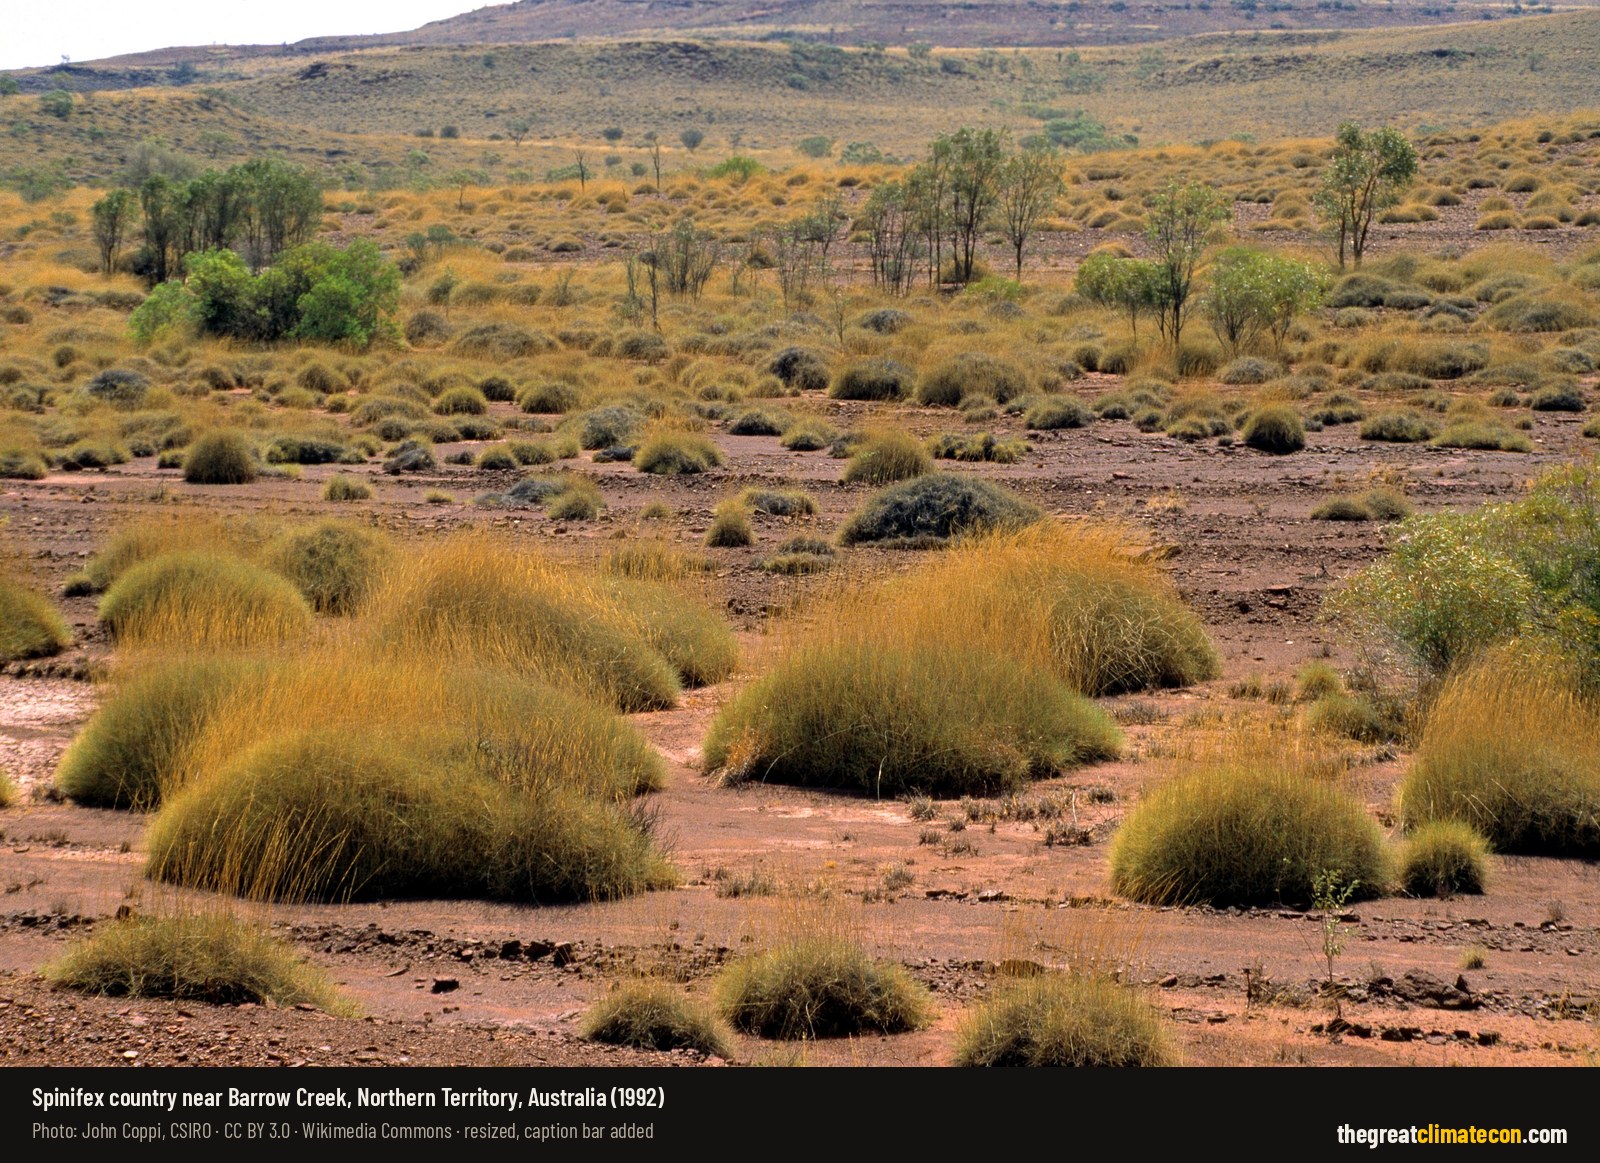
Donohue thinks it may also change which plants win: “Trees are re-invading grass lands, and this could quite possibly be related to the CO2 effect” (AGU).
What About The Sahara?
You’ll see it claimed online that the Sahara has shrunk by 8% since the 1980s. That 8% figure comes from a 2018 study that found woody vegetation cover across sub-Saharan Africa had increased by 8% over three decades. That’s trees and shrubs spreading south of the Sahara, not the desert itself shrinking by 8%. The same study found drivers “other than CO2” (less fire, plus warmer, wetter conditions) explained 78% of where it happened (Venter et al. 2018, Nature Communications).
What the record does show is a desert that breathes in and out with the rains. Looking at the full twentieth century, the Sahara grew by about 10%, and the authors flag that “multidecadal periods of desert expansion (including from the drying of the Sahel in the 1950s–80s) and contraction” make the answer depend heavily on which years you pick (Thomas & Nigam 2018, Journal of Climate). Another study found the same overall growth from 1950 to 2015, but split it in two. The Sahara expanded by about 35,000 km² a year from 1950 to 1984, then shrank by about 12,000 km² a year from 1984 to 2015 as the Sahel partly recovered (Liu & Xue 2020, Scientific Reports).
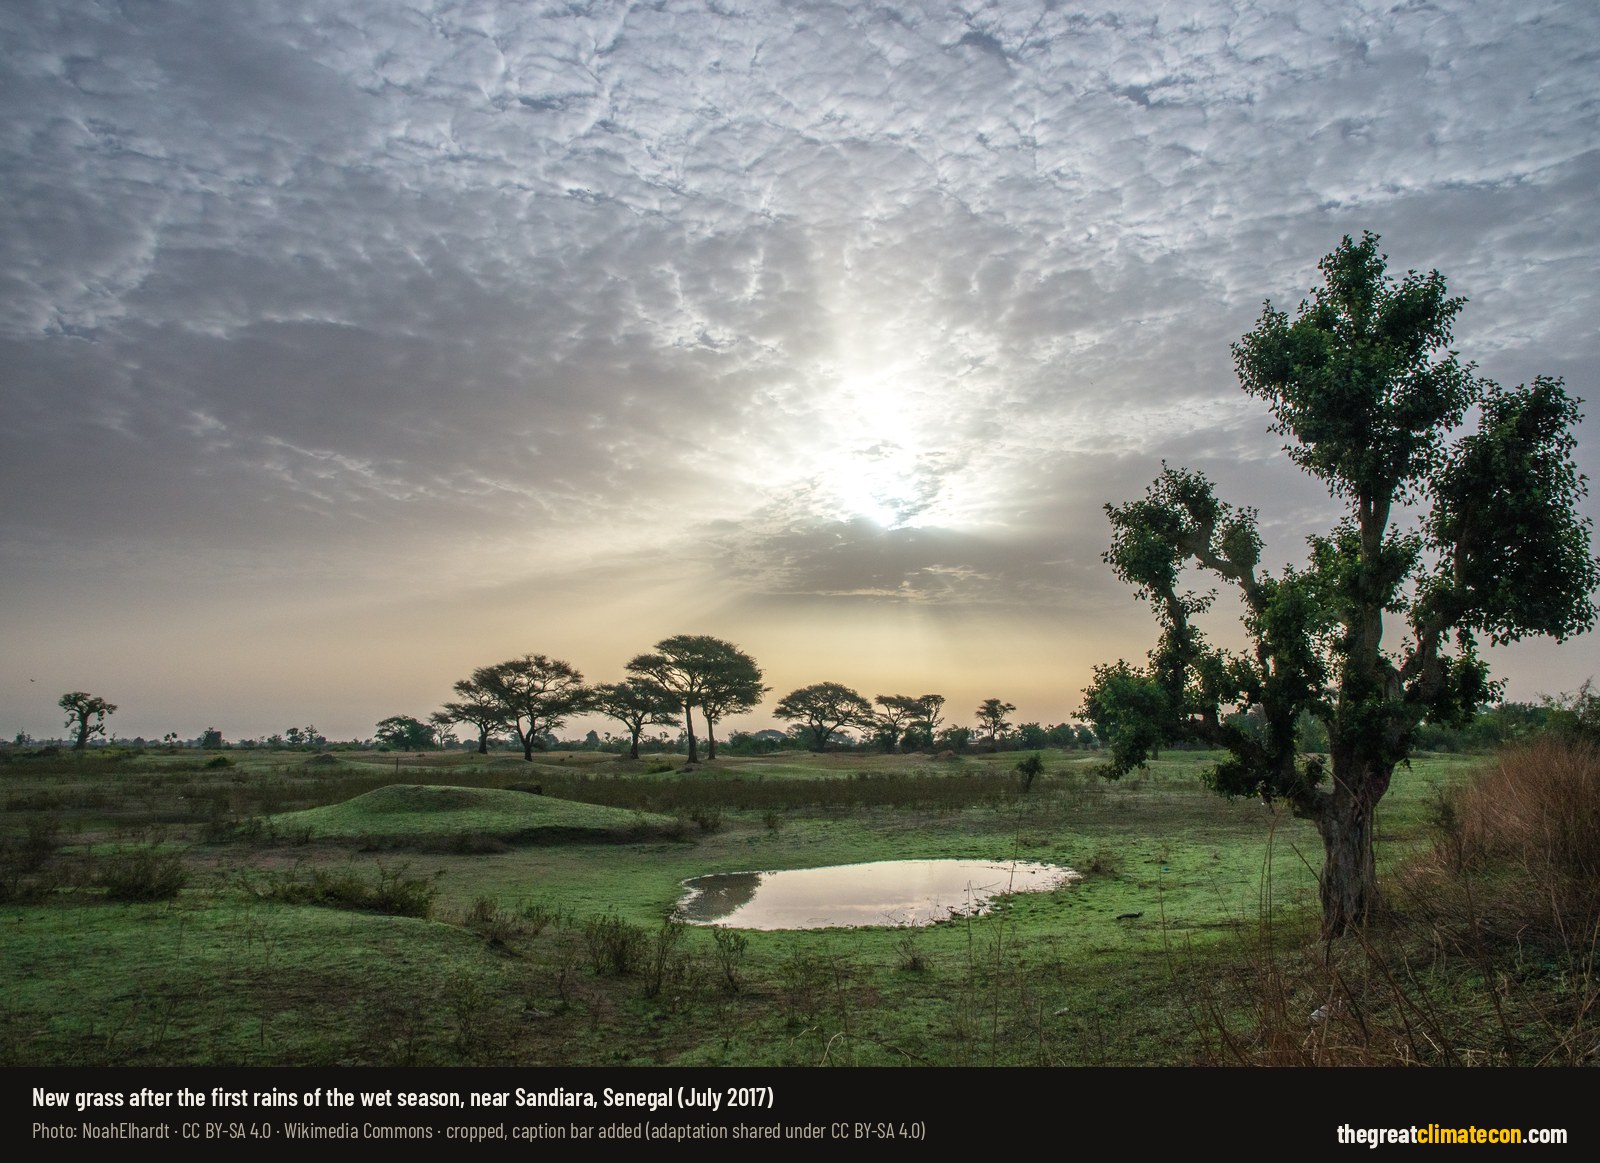
The Sahel, the belt along the Sahara’s southern edge, has been re-greening ever since the terrible droughts of the 1980s. Satellite trends over 1981–2011 are “positive and statistically significant almost everywhere in Sahel”, although some places, like the Fakara in western Niger, went the other way (Dardel et al. 2014). The researchers who first mapped this said it runs “contrary to assertions of widespread irreversible desertification”. They also found that “rainfall emerges as the dominant causative factor” there (Herrmann, Anyamba & Tucker 2005).
So the honest version is this. The deserts were supposed to expand, but since the 1980s the Sahara’s southern edge has been retreating. That’s the return of the rains, helped by more CO₂ and by farmers. It isn’t the doom we were promised.
CO₂ Is Plant Food, And The Planet Is Showing It
None of this is fringe. It comes from NASA, CSIRO, Boston University, Peking University and some of the most prestigious journals in science. Between a quarter and half of the planet’s vegetated land has greened since the early 1980s, adding leaf area equal to twice the continental United States. In the warm, dry lands, foliage cover is up 11% once rainfall is accounted for. Yet the story we’re sold is that CO₂ is pollution, and that the deserts are spreading.
CO₂ is plant food. Ask why that’s left out of the story.
The truth is on our side.
If you want to see how plants and trees have handled a changing climate before, read The Tree Under The Glacier and The Younger Dryas Problem For Climate Alarmism. And if you’re having these debates out in the real world, the Climate Con Conversation Mastery Course is free for members.
Discover, Understand, Liberate.
Sources: Zhu et al. 2016 · NASA 2016 · Carbon Brief 2016 · Chen et al. 2019 · NASA Earth Observatory 2019 · Piao et al. 2020 · Donohue et al. 2013 · CSIRO 2013 · AGU 2013 · Venter et al. 2018 · Thomas & Nigam 2018 · Liu & Xue 2020 · Dardel et al. 2014 · Herrmann et al. 2005 · Wang et al. 2020 · NOAA Mauna Loa




Wind Farm Map UK
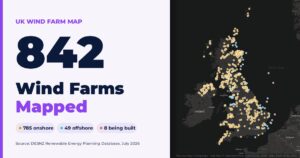
UK Wind Farm Map: 834 Operational Wind Farms Onshore operational 785 15,508.35 MW Offshore operational 49 16,011 MW Offshore under construction 8 11,845 MW Open

What Is A Photochrom?
A photochrom is a colour ink print made from a black-and-white photograph, produced and sold mainly from the 1890s to the 1910s. That is why these views are such useful dated evidence of historic coasts.

17.2 Million Trees, 8,611 Hectares, And That’s Only Public Land
17.2 Million Trees, 8,611 Hectares, And That’s Only Public Land Forestry and Land Scotland says 8,611 hectares of woodland have been felled for wind farms
Britain Demolished Its Backup: 34 GW of Reliable Power Gone While China Built 1,052 GW of Coal
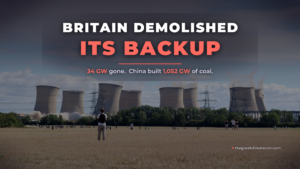
Britain closed 33.9 GW of coal and oil plant from 21 stations now demolished, being pulled down, or otherwise taken off the grid. In the same years China commissioned 1,052 GW of new coal, about 31 times as much. When transmission-metered wind averaged just 0.60 GW on 8 November, the grid leaned on gas and paid emergency prices.

33% Ordered, 26.6% Bought: Why Ministers Are Set To Cut Britain’s EV Target As COP31 Opens
Buyers chose 26.6% electric against a legal 33% target. Now ministers are set to cut it, in the same week COP31 opens.

£40m For Caribbean Green Energy Schemes. 5.6 Million British Homes Going Hungry. Charity Begins At Home?
In the 1920s, floods, droughts, storms and wildfires killed around 485,000 people a year. Today it’s about 12,000, on a planet with more than four times as many people. Lucy Biggers asked the question the climate lobby can’t answer: if the climate is so deadly, why doesn’t it show up in the death toll?