
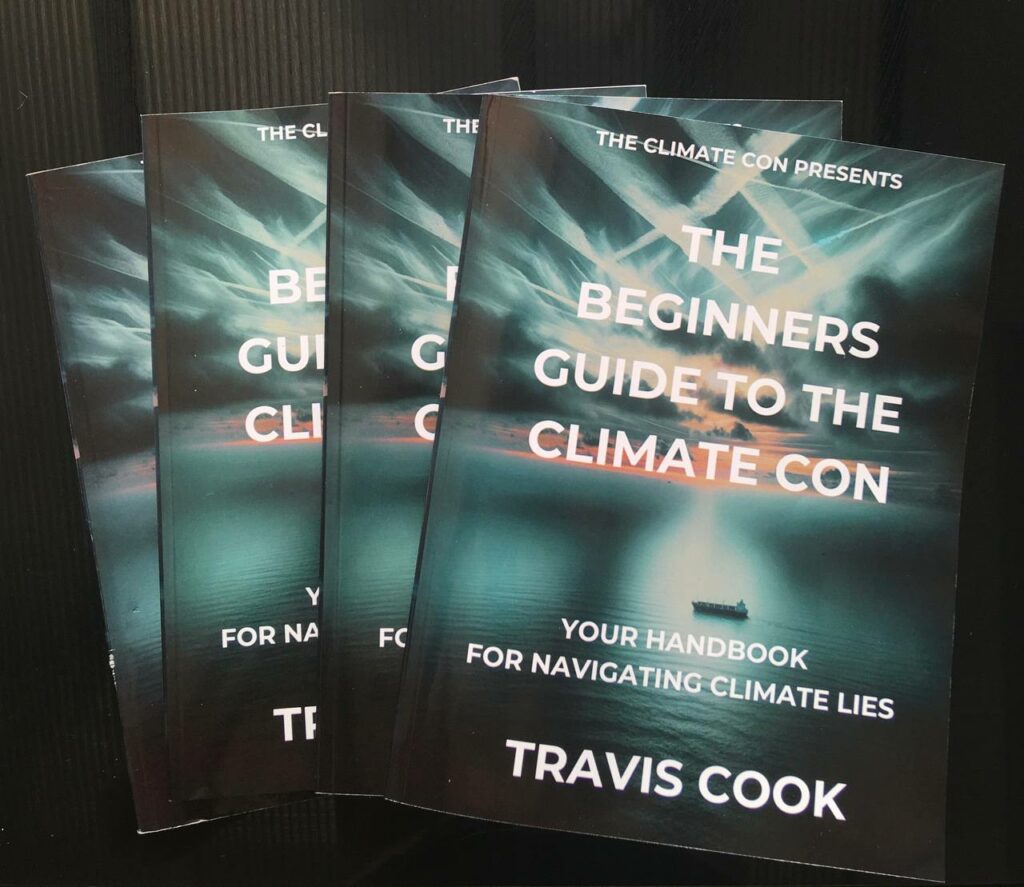

The Insanity Of The UK Going Net Zero Revealed In Easy To Understand Graphs
The Uk’s contribution to the global atmosphere is so small it is a rounding error. You wouldn’t notice it if it vanished from the data entirely. So why are we destroying ourselves in the name of net zero!?
There is a major push for the UK to destroy itself in the name of net zero but these handy graphs will reveal the true insanity of this and why it is completely unnecessary.
Total Greenhouse Gases In The Atmosphere
The Greenhouses Gases Broken Down
The Amount Of CO2 Emissions Generated By Humanity VS Nature
Humanities CO2 Emissions Broken Down By Country
Learn More About The Truth About CO2 And The Climate Con
There you have it, the insanity revealed, plain as day.
To summarise: of the total gases in the atmosphere, 98% is nitrogen, oxygen, argon and other gases. Only 2% are considered green houses gases.
Of this 2%, 95% is water vapour and 4% is CO2.
Of the 4% that is CO2 96% comes from natural sources and 4% comes from humanity.
Then of the human emissions, the UK contributes 1% of the total.
So in other words, of the total gases in the atmosphere the UK contributes with its CO2 emissions is 0.00042% of the total. A rounding error, you wouldn’t notice it if the UK vanished from the face of the earth. So small of a number it wouldn’t be worthwhile making a pie chart showing it.
So why is the UK destroying itself to reduce an insignificant amount of gases going into the atmosphere!? Well, pretty much everyone on this page knows why because we know the truth about CO2 and the larger agenda behind it. Much of the public doesn’t, yet, and that’s where The Climate Con Army steps in to be information warriors and disseminate the truth about the climate.
At The Climate Con we are dedicated to bringing the truth to the people about CO2. We have vast amounts of information available on our website in the form of podcasts with scientists, videos, articles, a book and a new course. Find all of this and more and take your educational journey into your own hands and discover the truth about the climate hidden from you.
Continue Your Learning

36-Year High: They Said The Great Barrier Reef Was Dying. Then It Recorded The Most Coral Since Monitoring Began
In 2022 Australia’s official reef monitors recorded the most coral on the northern and central Great Barrier Reef in 36 years. Ten years earlier, the forecast was 5–10%.
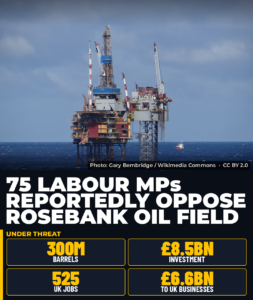
75 Labour MPs Reportedly Want 300 Million Barrels Of British Oil Left In The Ground. So We Just Import It Instead?
A reported 75 Labour MPs have signed a letter against Rosebank, around 300 million barrels of oil west of Shetland. Stop it and Britain loses £8.5bn of investment and 525 UK jobs, and still buys the oil, just from abroad.
Wind Farm Map UK
Every operational UK wind farm on one map: 834 sites and 31,519 MW (31.5 GW) from the government’s DESNZ Renewable Energy Planning Database, July 2026 extract.
What Is A Photochrom?
A photochrom is a colour ink print made from a black-and-white photograph, produced and sold mainly from the 1890s to the 1910s. That is why these views are such useful dated evidence of historic coasts.
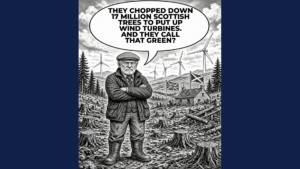
17.2 Million Trees, 8,611 Hectares, And That’s Only Public Land
Forestry and Land Scotland recorded 8,611 hectares felled for wind farms on Scotland’s national forest since 2000, about 17.2 million trees. Private forests are not included.
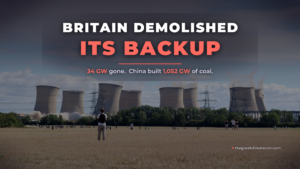
Britain Demolished Its Backup: 34 GW of Reliable Power Gone While China Built 1,052 GW of Coal
Britain closed 33.9 GW of coal and oil plant from 21 stations now demolished, being pulled down, or otherwise taken off the grid. In the same years China commissioned 1,052 GW of new coal, about 31 times as much. When transmission-metered wind averaged just 0.60 GW on 8 November, the grid leaned on gas and paid emergency prices.
Track The Cost Of Net Zero
Stay ahead of the transition with real-time cost monitoring and optimization tools.
Access Cost Trackers →