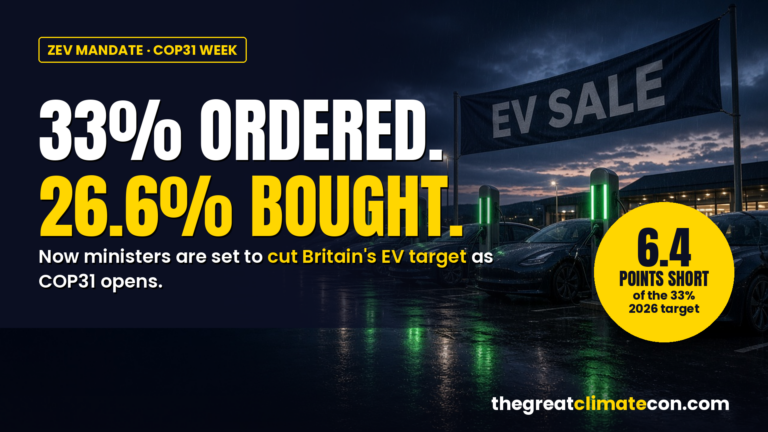
33% Ordered, 26.6% Bought: Why Ministers Are Set To Cut Britain’s EV Target As COP31 Opens
Buyers chose 26.6% electric against a legal 33% target. Now ministers are set to cut it, in the same week COP31 opens.

The total cost of renewables and Net Zero initiatives in the UK since 2000. Source: Department for Energy Security and Net Zero, Carbon Free Europe And The Climate Change Committee.
Real time trackers for Net Zero displaying just how much all of this is costing us. From birds killed by turbines to farmland lost to renewables to the insane money being spent every second. Witness the controlled demolition of the UK in real time.
Every figure below ticks up live, second by second, from the sources listed on each card.
The total cost of renewables and Net Zero since 14th April 2025, when this page was created.
Source: Department for Energy Security and Net Zero, Carbon Free Europe And The Climate Change Committee.
The total amount of UK tax money diverted to net zero subsidies since 2000.
Source: Department for Energy Security and Net Zero, Carbon Free Europe And The Climate Change Committee.
The total cost of solar energy projects in the UK since 2000.
Source: Department for Energy Security and Net Zero, Carbon Free Europe And The Climate Change Committee.
The total cost of carbon capture and storage (CCS) projects in the UK since 2000.
Source: Department for Energy Security and Net Zero, Carbon Free Europe And The Climate Change Committee.
The total amount of constraint payments made to UK wind turbine operators since April 2025 to curtail generation due to grid capacity limitations.
Source: National Energy System Operator (NESO), RenewableUK, Renewable Energy Foundation.
Fields, farms and food production handed over to turbines and solar panels.
The total area of land dedicated to wind farms in the UK since 2000. This includes both the turbine footprints and surrounding areas.
Source: Department for Energy Security and Net Zero, UK Land Registry.
The total area of UK land dedicated to solar panel installations since 2000. This is projected to increase significantly by 2040.
Source: Department for Energy Security and Net Zero, UK Solar Industry Association.
The total amount of productive UK farmland that has been converted to renewable energy projects since 2000, reducing domestic food production capacity.
Source: Department for Environment, Food and Rural Affairs (DEFRA), National Farmers Union.
The estimated financial loss to the UK agricultural sector due to productive farmland being converted to renewable energy projects since 2000.
Source: National Farmers Union, UK Agricultural Economics Association.
The birds, the turbines and the jobs behind the headlines.
The estimated number of birds killed by wind turbines in the UK since 2000.
Source: Royal Society for the Protection of Birds (RSPB).
The total number of wind turbines installed in the UK, with projections for future growth.
Source: Department for Energy Security and Net Zero.
The estimated number of UK jobs lost or displaced due to net zero transition policies since 2000.
Source: Office for National Statistics (ONS) and research by NERA Economic Consulting.
Now you can see in real time just how much all this net zero nonsense is costing the UK.
The Climate Con movement is leading the way in the education of the nation on the truth about CO2. Because when enough people understand the truth about CO2 and why we want more of it, nobody will accept any lowering of living conditions just to lower CO2 emissions.
Get the latest articles, tracker updates and Climate Con news straight to your inbox.
The Climate Con is independent and reader funded. If this page opened your eyes, a small donation helps us reach more people.

Buyers chose 26.6% electric against a legal 33% target. Now ministers are set to cut it, in the same week COP31 opens.
In the 1920s, floods, droughts, storms and wildfires killed around 485,000 people a year. Today it’s about 12,000, on a planet with more than four times as many people. Lucy Biggers asked the question the climate lobby can’t answer: if the climate is so deadly, why doesn’t it show up in the death toll?
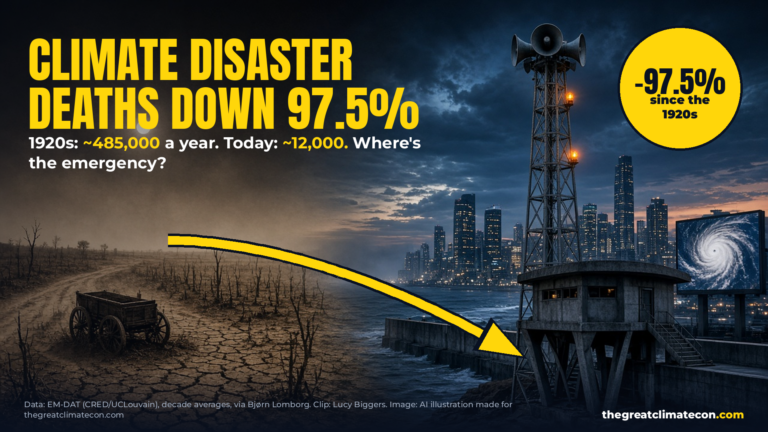
In the 1920s, floods, droughts, storms and wildfires killed around 485,000 people a year. Today it’s about 12,000, on a planet with more than four times as many people. Lucy Biggers asked the question the climate lobby can’t answer: if the climate is so deadly, why doesn’t it show up in the death toll?
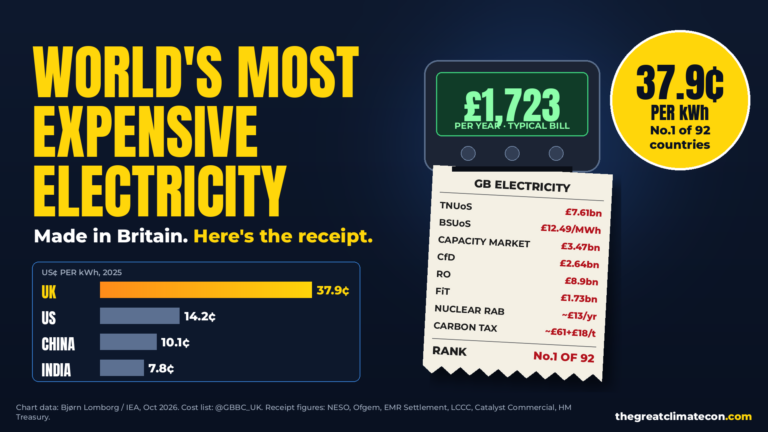
Britain now pays more for electricity than any of the 92 countries in Bjørn Lomborg’s IEA-based ranking, 2.7 times the US and 3.7 times China. It isn’t bad luck. It’s a stack of grid charges, green subsidies and carbon taxes added to every bill to keep a weather-dependent grid running. Here they are, line by line.
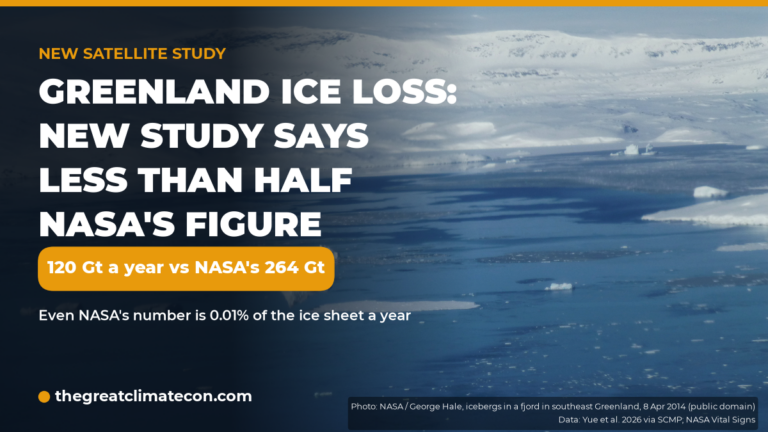
A new Chinese satellite study puts Greenland’s ice loss at about 120 billion tonnes a year, about half the international benchmark for the same years and 55% below NASA’s headline 264. Even the biggest official figure is about one hundredth of one per cent of the ice sheet a year.
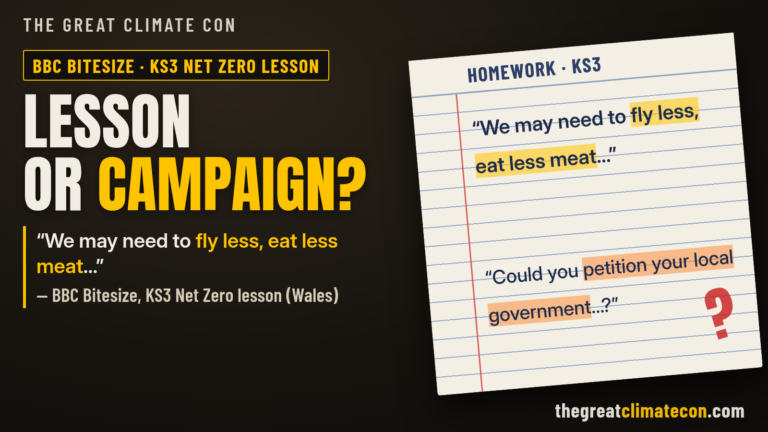
A BBC Bitesize net zero lesson tells 11 to 14-year-olds they “may need to fly less, eat less meat” and asks if they could petition the council. Is that a lesson or a campaign?
Unlock the Learning Centre, the members-only beta of the game, and help fund the fight back against net zero.
The latest updates from The Climate Con, straight to your inbox.
No spam, unsubscribe anytime. We use Brevo as our marketing platform; by subscribing you agree your details are sent to Brevo for processing under their terms of use.
Continue your learning at Thegreatclimatecon.com