

Is Weather Becoming More Extreme?
The climate cult would have you believe it is the end of the world tomorrow!
The climate cult and the legacy media would have you believe it is the end of the world tomorrow. Are there any basis to these claims or has this cult really jumped off the fear deep end and are now caught in an endless doom spiral of non existent apocalyptic computer model madness?
In this article we’re going to show you how weather isn’t becoming more extreme, in fact the opposite is happening and we will round off with the very important good news which is that it is the safest time to be alive in terms of dying from climate related deaths!
The Deceptions Around Temperature Increase
The urban heat island effect (UHI) exacerbates this issue. Cities, with their concrete, asphalt, and infrastructure, absorb and retain heat, significantly elevating local temperatures—particularly minimum nighttime readings. Unlike rural areas, urban stations often record higher lows due to heat retention, skewing datasets toward warming trends. Many Stevenson screens are located near urban centres, roads, or buildings, violating World Meteorological Organisation siting guidelines. This placement amplifies UHI bias, yet these stations contribute to global temperature records without adequate correction.
A study by McKitrick and Michaels (2007), suggest UHI can inflate temperature trends by up to 0.2°C per decade in urbanised datasets. Without rigorous adjustments for UHI and screen deficiencies, the data feeding climate models misrepresents actual global trends, undermining claims of catastrophic warming. CO2’s role is overstated when measurement flaws are ignored.
So because a lot of these Stevenson Screens are in areas that have the heat island effect and due to increasing urban sprawl enveloping more and more area around these screens we are seeing increasingly distorted data. A report by Lewis Brackpool recently uncovered that over 80% of the UK temperature stations used by the Met Office are unreliable. Another freedom of information request by the Daily Sceptic in 2024 found that the Met Office weather stations only have about 14% operating without warning attached. Madness isn’t it!? We are destroying our society for no good reason. The climate cult are dragging our economy and livelihoods into the ground with data that isn’t accurate and has been collected with devices that look like a beehive on stilts. Insanity. This is then causing the deaths of our elderly who can’t afford to heat their homes in winter because we’re trying to satisfy the insatiable demands of net zero.
For a more detailed explanation on the limitations of Stevenson Screens and more, check out the excellent video below by Paul Burgess. And if you have the time, check out the great show Paul and I did for the Climate Con podcast a while back.
CO2 Plays A Role In Warming But It's Effect Is Overstated And Misunderstood
For example, doubling CO2 from pre-industrial levels (280 ppm) to 560 ppm might cause a modest temperature rise, but doubling again to 1120 ppm doesn’t double the warming we would see from 280 to 560, it’s not a linear temperature spike. This saturation effect is evident in Earth’s history, where high CO2 levels didn’t trigger runaway warming. Mainstream models often amplify CO2’s impact through assumed feedbacks, like water vapor, but these are uncertain and may exaggerate warming projections. At current levels (420 ppm), CO2’s warming potential is likely overstated, especially when considering its benefits, such as boosting plant growth. The logarithmic decline challenges alarmist claims, suggesting that CO2’s role in driving catastrophic climate change is less significant than portrayed, and the focus on it distracts from practical environmental solutions. Read more about CO2 here or watch the numerous podcasts we have on the subject with scientists here.
Average Rainfall Has Increased In The UK Since 1850 And Extremes Are Decreasing
The Mild Warming Since 1800's Has Resulted In Less Extreme Weather
Since the 1800s, global temperatures have risen by roughly 1–1.2°C, largely due to CO2 increases, with warming concentrated at the Earth’s poles and during colder seasons. This pattern, known as polar amplification, reduces temperature gradients between polar and tropical regions, leading to less extreme weather overall. Smaller gradients weaken the jet stream, which drives intense storms, blizzards, and heatwaves. A more stable jet stream means fewer erratic atmospheric shifts, calming the conditions that spawn violent weather.
Historical data supports this. The Little Ice Age (1300–1850) saw sharper temperature contrasts, fuelling more frequent and severe storms, cold snaps, and droughts. As warming has progressed, particularly in colder regions like the Arctic, the polar vortex has weakened, reducing the frequency of brutal winter storms spilling into mid-latitudes. Tropical cyclones, while still potent, show no clear increase in frequency; global hurricane activity has slightly declined since the 19th century. Milder winters and fewer frost days also limit ice storms and blizzards. Wildfires are happening less. All of this and more covered in part 2 of the 8th episode of The Climate Con podcast.
It's The Safest Time To Be Alive In Terms Of Dying From The Climate
This great graph by Bjorn Lomborg tells us everything we need to know about the climate cults never ending peddling of doom.
“The truth is that deaths from climate disasters have fallen dramatically because wealthier countries are much better at protecting citizens. Research shows this phenomenon consistently across almost all catastrophes, including storms, floods, cold and heatwaves.” Read the full article here.
So my friends it doesn’t actually appear to be the end of the world, tomorrow. In fact, it is the most amazing time to be alive so lets make the most of it.
Continue Your Learning

36-Year High: They Said The Great Barrier Reef Was Dying. Then It Recorded The Most Coral Since Monitoring Began
In 2022 Australia’s official reef monitors recorded the most coral on the northern and central Great Barrier Reef in 36 years. Ten years earlier, the forecast was 5–10%.
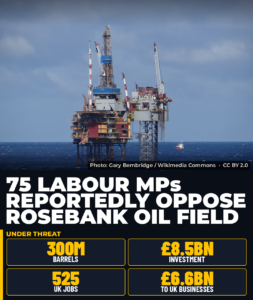
75 Labour MPs Reportedly Want 300 Million Barrels Of British Oil Left In The Ground. So We Just Import It Instead?
A reported 75 Labour MPs have signed a letter against Rosebank, around 300 million barrels of oil west of Shetland. Stop it and Britain loses £8.5bn of investment and 525 UK jobs, and still buys the oil, just from abroad.
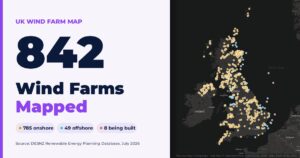
Wind Farm Map UK
Every operational UK wind farm on one map: 834 sites and 31,519 MW (31.5 GW) from the government’s DESNZ Renewable Energy Planning Database, July 2026 extract.

What Is A Photochrom?
A photochrom is a colour ink print made from a black-and-white photograph, produced and sold mainly from the 1890s to the 1910s. That is why these views are such useful dated evidence of historic coasts.

17.2 Million Trees, 8,611 Hectares, And That’s Only Public Land
Forestry and Land Scotland recorded 8,611 hectares felled for wind farms on Scotland’s national forest since 2000, about 17.2 million trees. Private forests are not included.
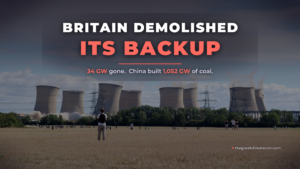
Britain Demolished Its Backup: 34 GW of Reliable Power Gone While China Built 1,052 GW of Coal
Britain closed 33.9 GW of coal and oil plant from 21 stations now demolished, being pulled down, or otherwise taken off the grid. In the same years China commissioned 1,052 GW of new coal, about 31 times as much. When transmission-metered wind averaged just 0.60 GW on 8 November, the grid leaned on gas and paid emergency prices.
Track The Cost Of Net Zero
Stay ahead of the transition with real-time cost monitoring and optimization tools.
Access Cost Trackers →