

New Satellite Study Puts Greenland's Ice Loss At About Half The Official Estimates, And Even Those Are 0.01% A Year

Even the biggest official figure is about one hundredth of one per cent of the ice sheet a year

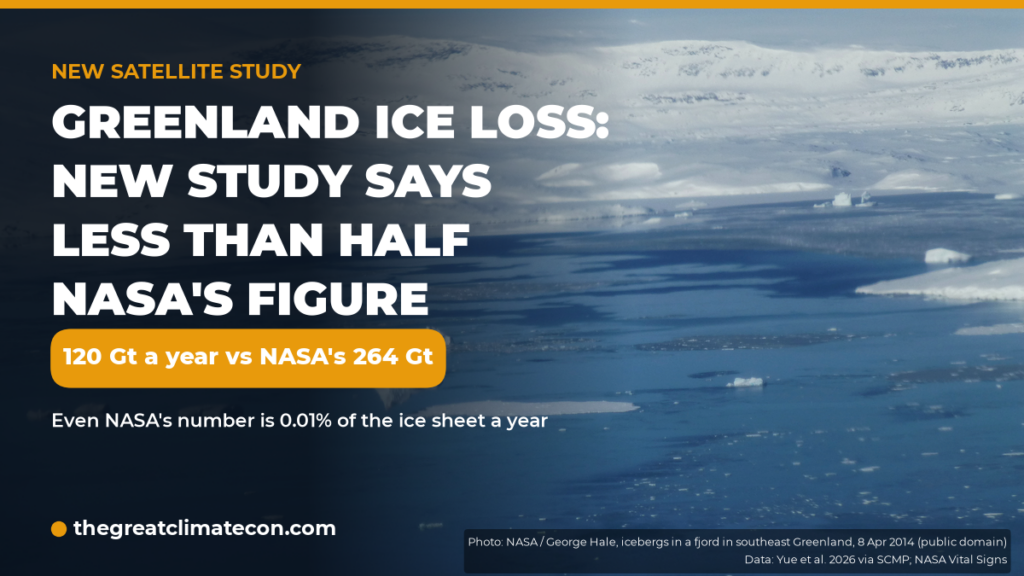
Every summer the headlines scream that Greenland is “collapsing”. Wrong. A new study out of China has measured the ice sheet from space and landed on about 120 billion tonnes a year, about half the international benchmark for the same years. Put in proportion, the numbers are not the horror story you are sold. Here is what the study found, how it compares with the official estimates, and what it means for sea level. So which number is “the science”? Take this and share it with your favourite Net Zero zealot.

What the new study found

Researchers at Jiangsu Ocean University (Yue Lianzhe, Liu Zitao, Zhou Tao and Li Ming) published their paper online, as an accepted manuscript, in the Chinese journal Marine Information Technology and Application on 19 October 2026. They took surface-height data from several satellite altimetry missions, used the MAR regional climate model to work out the density of the snow and ice, and turned the height changes into mass.

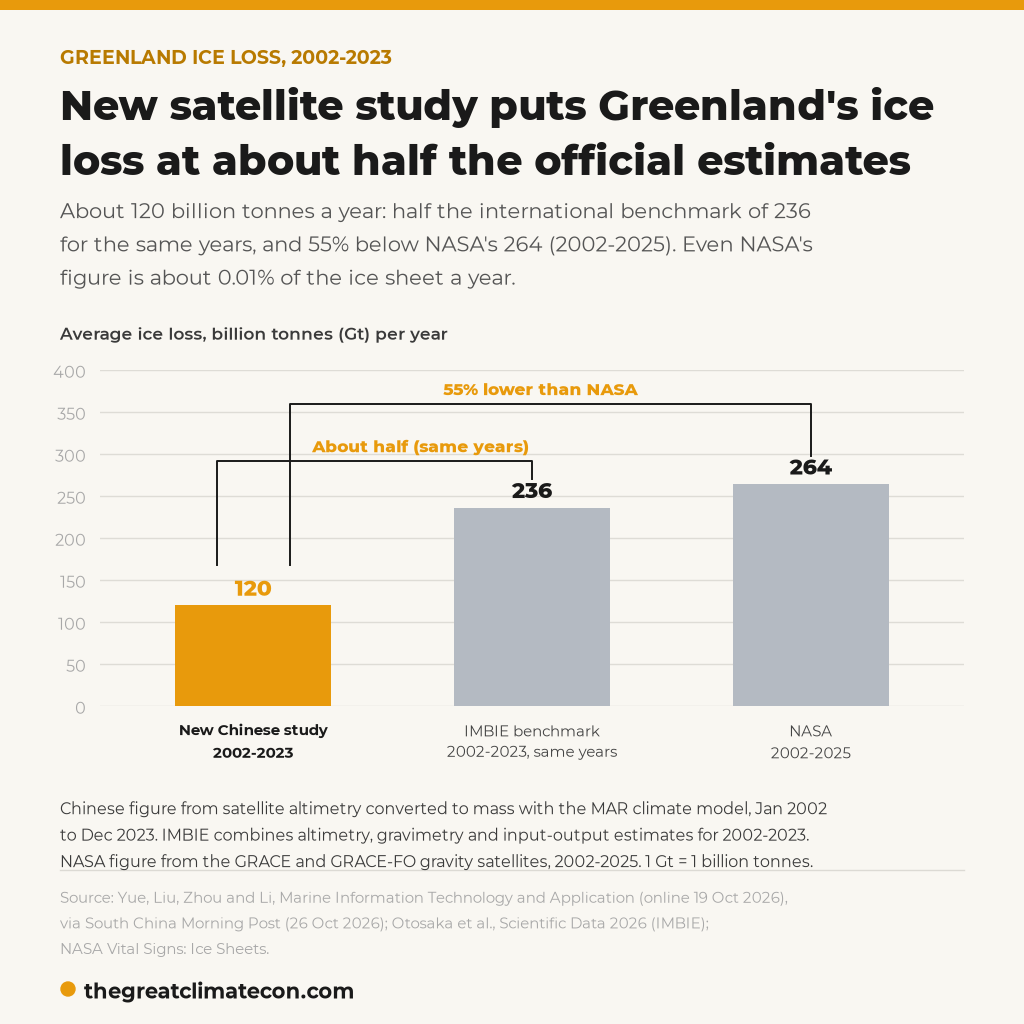
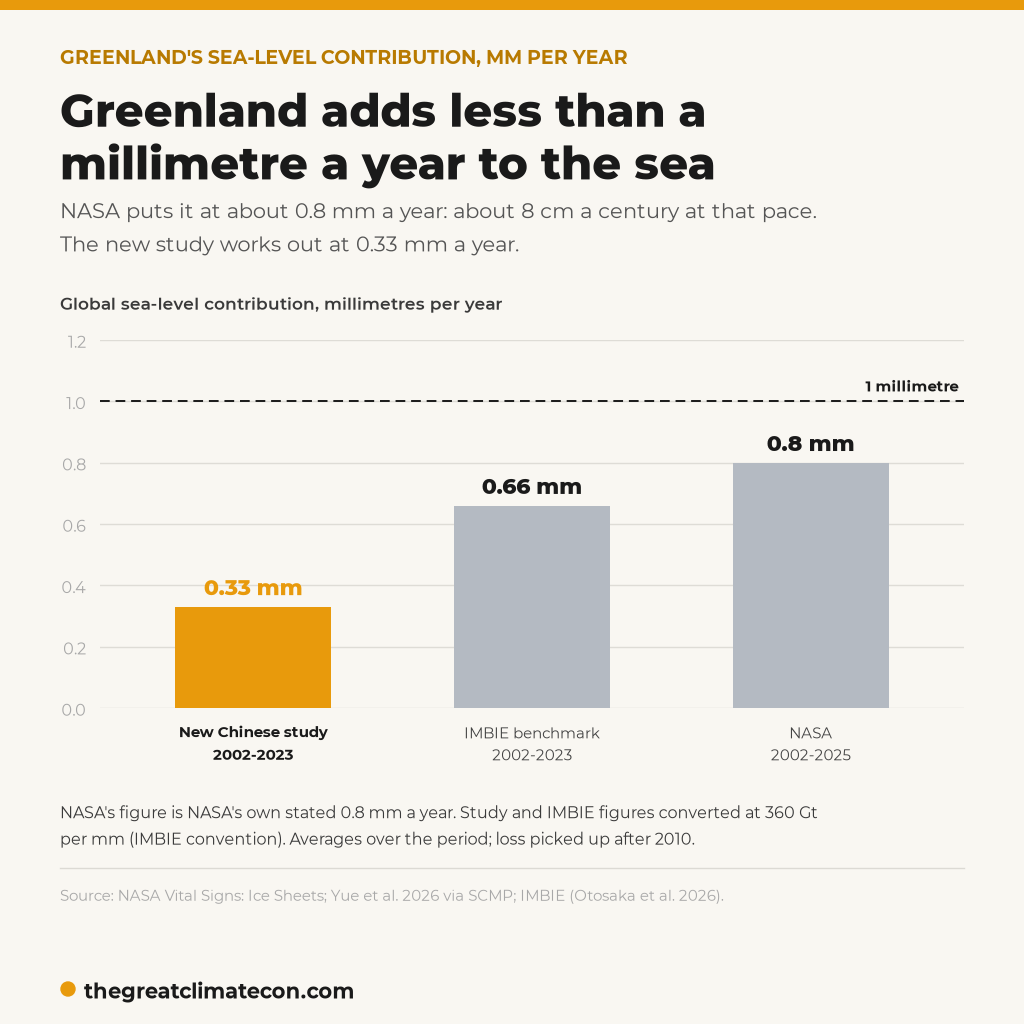
Their result for January 2002 to December 2023: Greenland lost an average of 119.69 ± 3.72 billion tonnes (gigatonnes, Gt) a year. That works out at about 0.33 mm of global sea level a year. The team also found that the loss sped up after 2010.

How it compares with the official numbers

The dates matter here.

  • IMBIE, the international team that combines every satellite method into one reconciled estimate, puts Greenland’s loss at 236 ± 12 Gt a year for 2002 to 2023, exactly the same years as the Chinese study. The new figure is about half of that.
  • NASA’s Vital Signs page, based on the GRACE and GRACE Follow-On gravity satellites, says about 264 Gt a year for 2002 to 2025, a slightly longer period. Against that headline number the Chinese figure is about 55% lower, which is the gap behind the SCMP story.

So when you are told the science is settled to the last decimal place, remember this: serious, satellite-based estimates for the same ice sheet over the same two decades run from about 120 Gt a year to 236 Gt a year.

Put it next to the size of the ice sheet

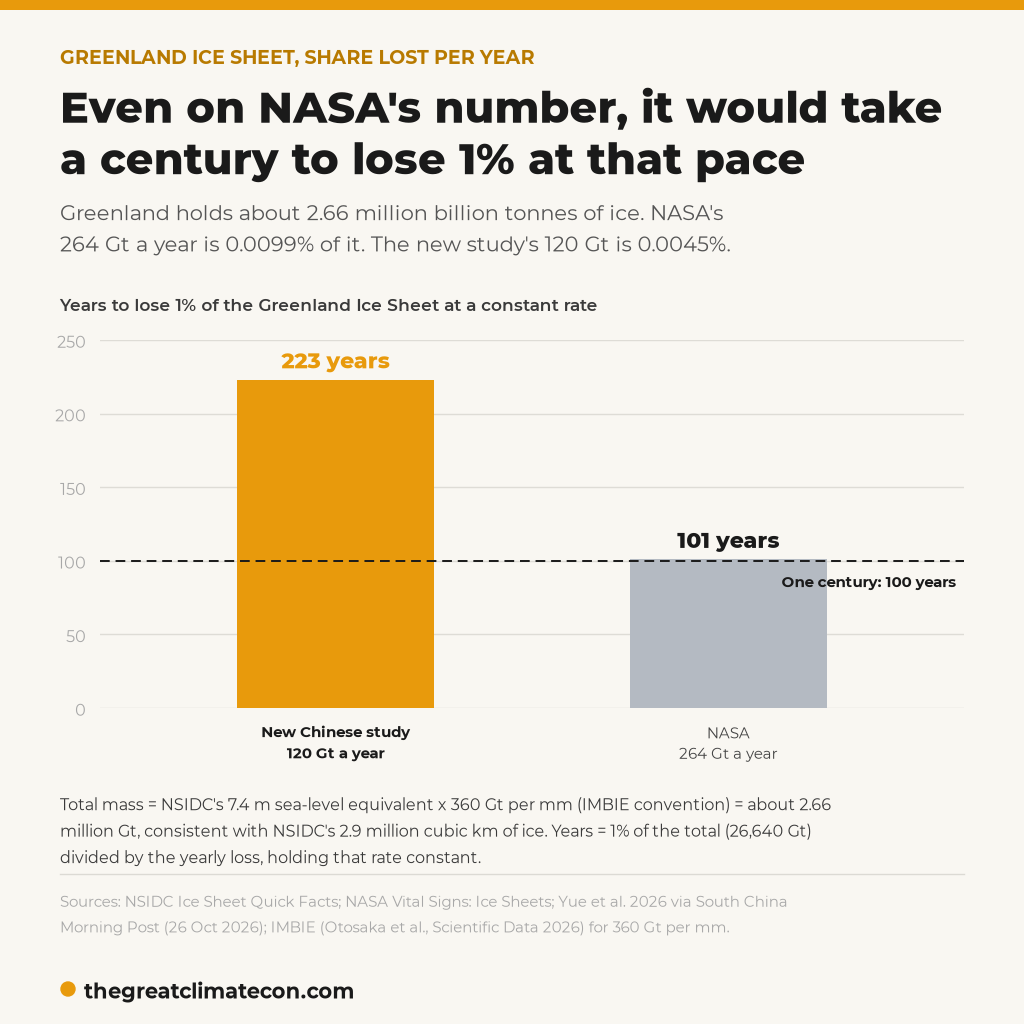
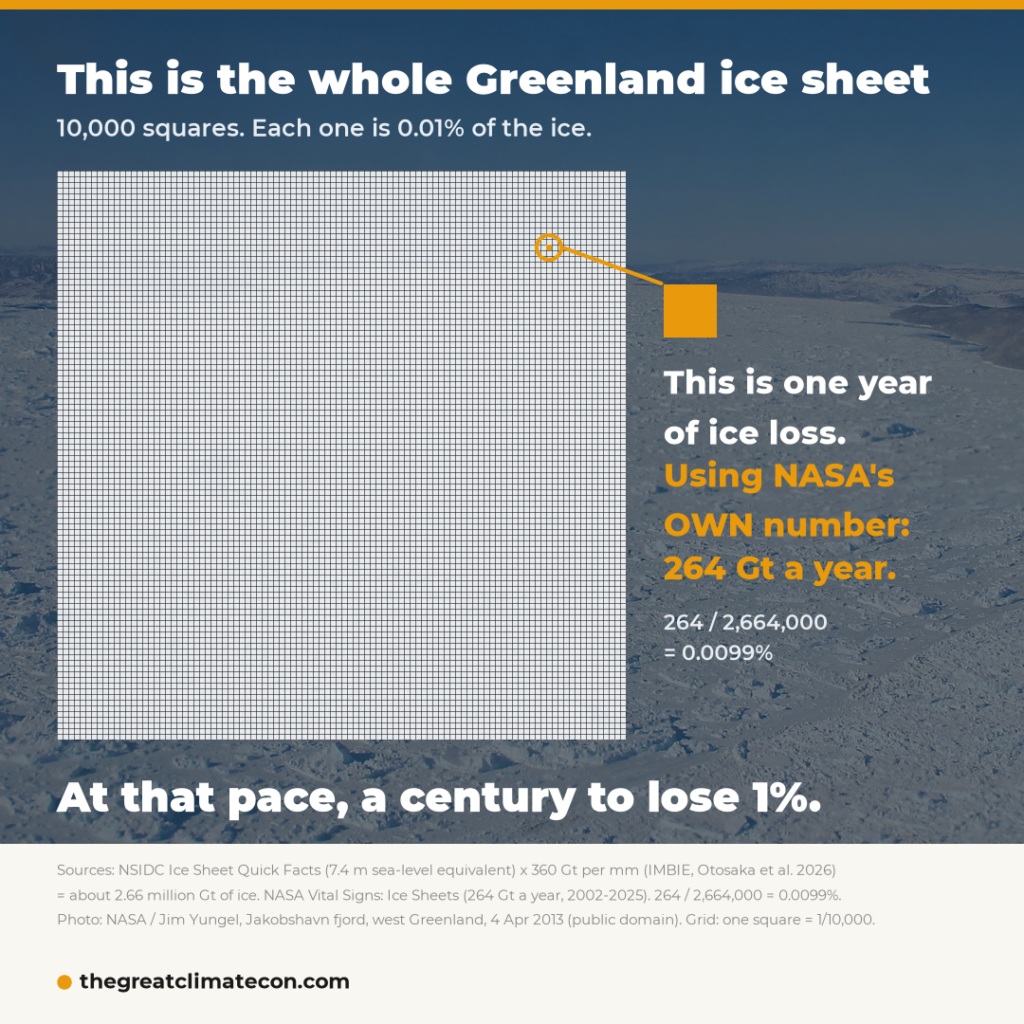
This is the part the alarmists leave out. According to the US National Snow and Ice Data Center (NSIDC), the Greenland Ice Sheet holds about 2.9 million cubic kilometres of ice, enough to raise sea level by about 7.4 metres if every last bit melted. Using the standard 360 Gt per millimetre of sea level, that is roughly 2.66 million Gt of ice.

  • NASA’s 264 Gt a year is about 0.0099% of the ice sheet each year. At that pace it would take about 101 years to lose just 1%: one square in 10,000 gone each year.
  • The new 120 Gt a year is about 0.0045% a year. At that pace, 1% takes about 223 years.

Loss has run faster since 2010 than before it, so those are averages for the whole period, not forecasts. Even so, the scale is clear: the ice sheet is losing hundredths of a per cent a year, not chunks of itself.

What it means for your sea level

Take NASA’s own figure: about 0.8 mm a year. That is less than a millimetre. Keep that pace for a century and you get about 8 cm.

On the new Chinese figure, 120 Gt a year works out at about 0.33 mm a year, less than half the thickness of a standard bank card (0.76 mm). At that pace, that is about 3.3 cm a century. Loss picked up after 2010, but these are the measured averages.

This lines up with what we covered in New Study Confirms No Acceleration In Sea Level Rise: Voortman (2025) found no statistically significant acceleration at about 95% of suitable tide-gauge locations.

Greenland has always changed

Greenland has never stood still. The Vikings farmed there during the Medieval Warm Period, as we wrote in Greenland Is Called Greenland Because It Used To Be Green?. Ice comes and goes, and trees turn up under retreating glaciers, as in The Tree Under The Glacier. And we have heard ice doom before: prediction after prediction of an ice-free Arctic came and went. See 20 Of The Best Ice Free Arctic Failed Predictions.

The bottom line

  • A new satellite study puts Greenland’s ice loss at about 120 Gt a year (2002 to 2023): about half the international benchmark of 236 Gt for the same years, and less than half NASA’s headline 264 Gt (2002 to 2025).
  • Even NASA’s figure is about one hundredth of one per cent of the ice sheet a year.

  • That is about 0.8 mm of sea level a year on NASA’s own numbers: less than a millimetre.

The ice sheet is not vanishing. Share this with your favourite Net Zero zealot and ask them which number is “the science”.

Hat tip to the South China Morning Post for the original report.

Sources

  1. South China Morning Post, Victoria Bela, “Why China’s new estimate on Greenland ice loss speed is 55% lower than America’s”, 26 October 2026: https://www.scmp.com/news/china/science/article/3372129/why-chinas-new-estimate-greenland-ice-loss-speed-55-lower-americas
  2. Yue Lianzhe, Liu Zitao, Zhou Tao, Li Ming (Jiangsu Ocean University), “联合多源卫星数据的格陵兰冰盖质量变化时空特征分析” (Spatio-temporal analysis of Greenland Ice Sheet mass change combining multi-source satellite data), Marine Information Technology and Application (海洋信息技术与应用), accepted manuscript published online 19 October 2026 (CNKI ID HTXX20261014001): https://htxx.cbpt.cnki.net/portal/journal/portal/client/paper/cdb197c18d64b8aaa3133851aa055a7d
  3. NASA Vital Signs, Ice Sheets: https://climate.nasa.gov/vital-signs/ice-sheets/
  4. Otosaka et al. (IMBIE), “Mass balance of the Greenland and Antarctic ice sheets from the 1970s to 2023”, Scientific Data 13, 1301 (2026), Greenland 236 ± 12 Gt a year for 2002 to 2023, and the 360 Gt per mm convention: https://doi.org/10.1038/s41597-026-08088-0
  5. NSIDC, Ice Sheet Quick Facts: https://nsidc.org/learn/parts-cryosphere/ice-sheets/ice-sheet-quick-facts
  6. ISO/IEC 7810 card thickness (0.76 mm): https://en.wikipedia.org/wiki/ISO/IEC_7810
  7. Voortman (2025), J. Mar. Sci. Eng. 13(9):1641: https://www.mdpi.com/2077-1312/13/9/1641

The Advanced Guide To The Climate Con

The Beginners Guide To The Climate Con

Continue Your Learning

📊

Track The Cost Of Net Zero

Stay ahead of the transition with real-time cost monitoring and optimization tools.

Access Cost Trackers →

Leave a Comment